The complexity of concept mapping for policy analysis
William Trochim
Cornell University, USA
Derek Cabrera
Cornell University, USA
Abstract
Concept mapping is a participatory mixed methodology that enables diverse participant groups to develop shared conceptual frameworks that can be used in a variety of policy contexts to identify or encourage complexity, and the adaptive emergent properties associated with it. The method is consistent with an evolving paradigm of complex adaptive systems thinking and helps groups address complexity in several ways: it is inductive, allowing shared meaning to emerge; it is based on a simple set of rules (operations) that generate complex patterns and results; it engages diverse agents throughout the process through a range of participation channels (synchronous or asynchronous web, face-to-face, etc.); the visual products—the concept maps, pattern matches, action plots—provide high-level representations of evolving thinking; the results are generative, encouraging shared meaning and organizational learning while preserving individuality and diversity; the maps themselves provide a framework that enables autonomous agents to align action with broader organizational or systems vision. The concept mapping process involves free listing, unstructured sorting and rating of ideas, and a sequence of statistical analyses (multidimensional scaling, hierarchical cluster analysis) that produce maps and other results that the participants then interpret. An example is provided of a web-based project that mapped the practical challenges that need to be addressed to encourage and support effective systems thinking and modeling in public health work. It is suggested that using concept mapping especially in combination with other types of human simulation provides a valuable addition to our methodological tools for studying complex human systems.
The complexity of concept mapping for policy analysis
Contemporary complexity theory leaves many in the applied endeavors of policy analysis and management bewildered. While the notion of complexity—and especially its emphasis on emergent and dynamically adaptive properties—is inherently appealing to these audiences, there is a genuine confusion about how these attractive ideas might be applied in policy and management practice. The complexity literature is replete with examples of complex systems in nature such as ant colonies and slime molds, and with generalizable complex systems using simulated abstract agents such as termites and turtles. Even apparently more relevant examples, such as simulations of city neighborhood evolution (Krugman, 1996), or of traffic jams (Resnick, 1994), seem insufficient for addressing thorny ill-defined problems of human interactions in ‘soft’ systems—in short, the area where much of the most important policy analysis and management work occurs.
Much of the problem for people interested in these types of systems seems to center around methodology—or the lack of it. While the scientific and philosophical underpinnings for complexity are well established, and while there is a seemingly endless literature of management advice that is purportedly based on principles of complexity thinking (McKelvey, 1999), the policy analyst and manager look in vain for structured methodologies that can be used in practice contexts to describe or encourage complexity and its attendant emergent adaptive properties.
This paper nominates for inclusion in complexity methodology a participatory mixed methods approach known originally and technically as ‘structured conceptualization’ and more widely and colloquially as ‘concept mapping’. We begin with a brief introduction to the methodology of concept mapping and a review of the ways it is currently used in policy analysis and management contexts. We then present an example of a concept mapping project in public health where the focus was on the practice of systems thinking and modeling itself. The example is used both to introduce the method in some detail and illustrate its use in context. Finally, we use the results of this project to illustrate how complexity is related to the concept mapping methodology in at least three major ways: (1) concept mapping is itself a complex adaptive system (CAS); (2) the maps that result are useful for identifying the properties of complex systems in policy contexts; and (3) the maps can be used to manage human systems toward a goal while at the same time leveraging the dynamic, adaptive, evolutionary and emergent potential of complex systems. We conclude by suggesting how the methodology might be applied usefully to understand and encourage complexity in policy analysis and management contexts.
A brief introduction to concept mapping
Concept mapping is a participatory mixed methodology (Greene & Caracelli, 1997) that enables diverse individuals and groups to develop mutually comprehensible conceptual frameworks that can be used in a variety of policy contexts to identify or encourage complexity, and the adaptive emergent properties associated with it. The method is consistent with an evolving paradigm of complex adaptive systems thinking and helps groups address complexity in several ways:
- it is inductive, allowing shared meaning to emerge; it is based on a simple set of rules (operations) that generate complex patterns and results;
- it engages diverse agents throughout the process through a range of participation channels (synchronous or asynchronous web, face-to-face, etc.);
- the visual products provide simple high-level representations of evolving thinking;
- the results are generative, encouraging shared meaning and organizational learning while preserving individuality and diversity, and;
- the maps themselves provide a framework that enables autonomous agents to align action with broader organizational or systems vision.
Concept mapping is an integration of qualitative group process and quantitative analysis. There are six major steps in the process (Trochim, 1989b):
- Preparation and focus formulation: The initial preparatory phase of a concept mapping project pursues the spirit of Aristotle’s dictum that “Well begun is half done.” In this step we accomplish three major tasks. First, we identify who the participants will be, often using a snowball or successive sampling approach. Second, with the participants (or a subgroup of them) we determine the focus for the project. We typically accomplish this by developing a focus statement or prompt that defines the conceptual domain that the map is intended to address and delimits the boundary conditions for the ideas or issues that will be mapped. To call it a ‘focus’ statement may be a bit of a misnomer, because the statement can be a very broad one as in “Generate specific things our organization should address” or “One specific characteristic of ‘Construct X’ is…” In addition, in this step, we also determine the focus for any ratings or other measures that might be collected subsequently on the set of ideas or issues. Finally, we determine the scheduling and logistics for the project. A concept map can be developed in a face-to-face small group meeting at a conference setting over a day or two, it can involve hundreds or thousands of participants collaborating virtually over the web, or any combination of these.
- Generation of ideas or issues: In this step we generate a large set of issues or statements that address the focus statement and constitute the basis of the concept mapping project. Ideally, the participant group determines the process for generating the statements, typically through some type of idea generation (Nagasundaram & Alan, 1993; Philipsen, et al., 1979) method like brainstorming (Adams, 1979; Osborn, 1948) or a free listing process (Coxon, 1999). Alternatively, they could be compiled through a methodology for coding existing text (Jackson & Trochim, 2002) or through some form of content analysis (Krippendorf, 2004). In many cases, especially when the web is used for generating ideas, more statements are created than can feasibly be handled in subsequent steps. For most projects a maximum of about a hundred statements will be at the limit of what can be effectively processed. With web brainstorming, many of the statements will be repetitive or redundant. If hundreds or even thousands of statements are generated, it is necessary to synthesize them to a more manageable number. This is typically done through a combination of group process and content analysis (Krippendorf, 2004).
- Structuring of ideas or issues: In the structuring step the participants provide their sense of how the issues are organized or interrelated. This is accomplished primarily by having each participant do an unstructured similarity sorting (Coxon, 1999; Rosenberg & Kim, 1975; Weller & Romney, 1988) of the statements. This can be done either by manual card sorting, with one statement per card, or with suitable electronic technologies for sorting (e.g., Concept Systems Incorporated, 2004). Each participant is asked to place statements that they think of as similar together in groups or piles and to give each group a brief name. A statement can be placed in only one group (i.e., forced choice). There are no limits to the number of groups one can create as long as all statements are not placed in one group or each is not placed in its own group. In addition to the sort task, participants are usually asked to do one or more ratings of the statements. Typical ratings are of relative importance or feasibility of accomplishing each statement, usually measured using a simple (e.g., 0-1, 1-5 or 1-100) rating format. Finally we also typically gather some non-identifying demographic information about participants to make it possible to do subgroup comparisons of results.
- Representation of ideas or issues in maps: We ‘represent’ the ideas or issues by applying a sequence of algorithms to the sorting data (note that no rating or demographic data is used at this step). We begin by constructing from each person’s sort an N × N (where N = number of statements) binary, symmetric matrix of similarities, Xij. To do this, for each sort, for any two items i and j, a ‘1’ is placed in Xij if the two items were sorted in the same pile by the participant, otherwise a ‘0’ is entered (Coxon, 1999; Rosenberg & Kim, 1975; Weller & Romney, 1988). Then, we obtain a total matrix Tij by adding across the individual N × N similarity matrices. In this matrix, values range from 0 (no people sorted the i,j statement pair in the same pile) to the number of people who sorted (all of them sorted the two statements in the same pile). The total similarity matrix Tij is the input for non-metric multidimensional scaling (MDS) analysis with a two-dimensional solution. The solution is limited to two dimensions because, as Kruskal and Wish (1978) point out: “…when an MDS configuration is desired primarily as the foundation on which to display clustering results, then a two-dimensional configuration is far more useful than one involving three or more dimensions” (p. 58). The analysis creates the basic map—a two-dimensional (x,y) configuration of the set of statements—based on the criterion that statements sorted together most often (more similar) are closer on the map while those sorted together less frequently (less similar) are further apart. The usual statistic that is reported in MDS analysis to indicate the goodness of fit of the two-dimensional configuration to the original similarity matrix is called the stress value. Next, the x,y values from MDS are the input for hierarchical cluster analysis utilizing Ward’s algorithm (Everitt, 1980) as the basis for defining a cluster. Using the MDS configuration as input to the cluster analysis forces the cluster analysis to partition the MDS configuration into non-overlapping clusters in two-dimensional space. There is no simple rule by which a final number of clusters can be selected; typically a procedural algorithm is used (Trochim, 1989b). Many different maps can be produced from these results.
- Interpretation of results: The detailed map results are interpreted by the participants, or a subgroup of them, typically in a facilitated group meeting. They examine the various maps, discuss the cluster results and label each cluster. At this point, the rating and demographic data can be incorporated. In addition to standard tables of average ratings by statement and cluster, two specific graphics are typically produced: a pattern match graph and a bivariate plot (sometimes termed a ‘go zone’ plot). Both take bivariate rating data, either at the statement or cluster level, as input. They can be used to assess the consensus between two groups of participants, to look at the agreement across two different ratings (e.g., to compare importance and feasibility ratings) or to look at changes over time.
- Utilization of results: Participants may use the mapping results in a great variety of ways, depending on the circumstances and local needs. For instance, maps have been used to develop conceptual models for complex constructs (Daughtry & Kunkel, 1993; DeRidder, et al., 1997; Trochim, et al., 2003; White & Farrell, 2001); identify perspectives of diverse stakeholders (Donnelly, et al., 2000; Southern, et al., 2002; Trochim, et al., 1994); and, for planning and evaluation (Biegel, et al., 1997; Johnsen, et al., 2000; Shern, et al., 1995).
These are the six basic steps in the conceptual mapping algorithm. Using these simple rules, and allowing for different channels of participation (e.g., manual versus web-based) and different participant subgroups at each step, enables considerable complexity in possible mapping processes. The next section provides an example of a mapping project that illustrates the method and shows one way it has been implemented.
An example: Mapping the complexity of systems thinking in public health
The example project[1] used this systems method of concept mapping to map the challenges that systems thinking and modeling pose for public health with several groups of participants who have been exploring systems thinking and modeling, a type of ‘mise-en-abîme’[2] of systems using systems to study systems.
Participants: A total of 359 individuals, who comprise the email distribution lists of two large public health systems groups were invited to participate in the project. One group is the Syndemics Network sponsored by the U.S. Centers for Disease Control and Prevention (Milstein, 2004). The other is the Initiative on the Study and Implementation of Systems (ISIS) sponsored by the National Cancer Institute of the U.S. National Institutes of Health (Best, et al., in press). While both are based in the United States, their membership is international.
There were 133 unique visitors to the brainstorming webpage (since brainstorming is anonymous, it is unknown how many of these unique visitors actually added statements). There were 56 participants who completed the sort task and 54 who completed the ratings.
Procedures: The general procedure for concept mapping (Trochim, 1989b) was summarized above. Participants were notified of the study and directed to the brainstorming web address. They were able to take part either via fax or over the web; almost all participation was web-based[3]. The focus statement that guided the web-based brainstorming was:
“One specific practical challenge that needs to be addressed to encourage and support effective systems thinking and modeling in public health work is...”
Using asynchronous online brainstorming participants were allowed to enter as many statements as they wished and because there is no direct participant interaction there is no criticism or discussion about the statements. Between December, 2004 and February, 2005, the group generated 318 statements, which were synthesized and edited to a final set of 100 statements. Each participant was then invited to participate over the web in the sorting and rating tasks and was asked several simple demographics questions. For the rating, each participant was asked to rate each statement on a 5-point Likert-type response scale for how important the statement is (relative to the other statements) in terms of being a challenge that must be addressed to encourage and support systems thinking and modeling in public health, where 1=relatively unimportant (compared with the rest of the statements); 2=somewhat important; 3=moderately important; 4=very important, and, 5=extremely important.
Data Analysis. For the MDS analysis, the stress value was 0.300. This compares favorably with normative data on meta-analyses (Trochim, 1993) that showed that the average stress value across 33 projects was 0.285 with a range from 0.155 to 0.352. For the cluster analysis, an eight cluster solution was selected as the one that preserved the most detail and yielded substantively interpretable clusters of statements.
Results and discussion: The resulting maps were interpreted by the project facilitators and the directors of the two networks that participated. The statements in each cluster were reviewed and a consensus achieved about the appropriate cluster labels. The labeled cluster map is shown in Figure 1.
Beginning on the lower right of the map, and proceeding clockwise, the cluster Explore Systems Paradigms & Perspectives[4] included statements (N=15) that describe the paradigmatic shifts associated with systems thinking and the influence of such thinking on the perspectives people bring to public health work. For example, one of the fifteen statements in this cluster was: “Recognize the importance of a systems paradigm to public health (e.g., ecological, systemic, holistic, participatory, multi-dimensional, constructivist, adaptive, complex and nonlinear frameworks).” The cluster Utilize Systems Incentives (N=14) emphasized the need to address political and social factors that influence the use of systems thinking, including issues of bureaucracy, people’s fears (e.g., job loss, too difficult, fear of change), factors in academic environments that limit adoption or use of systems approaches, and jurisdictional conflicts among organizations. The Expand Cross-Category Funding cluster had the highest average importance rating and consisted of statements (N=10) primarily related to funding. The term ‘cross-category’ was used in the label because these statements challenge traditional funding categories and explicitly encourage a more integrative systems-based view of financing. For instance, one of the statements in this cluster was: “Increase funding for transdisciplinary and inter-agency collaborative projects with a
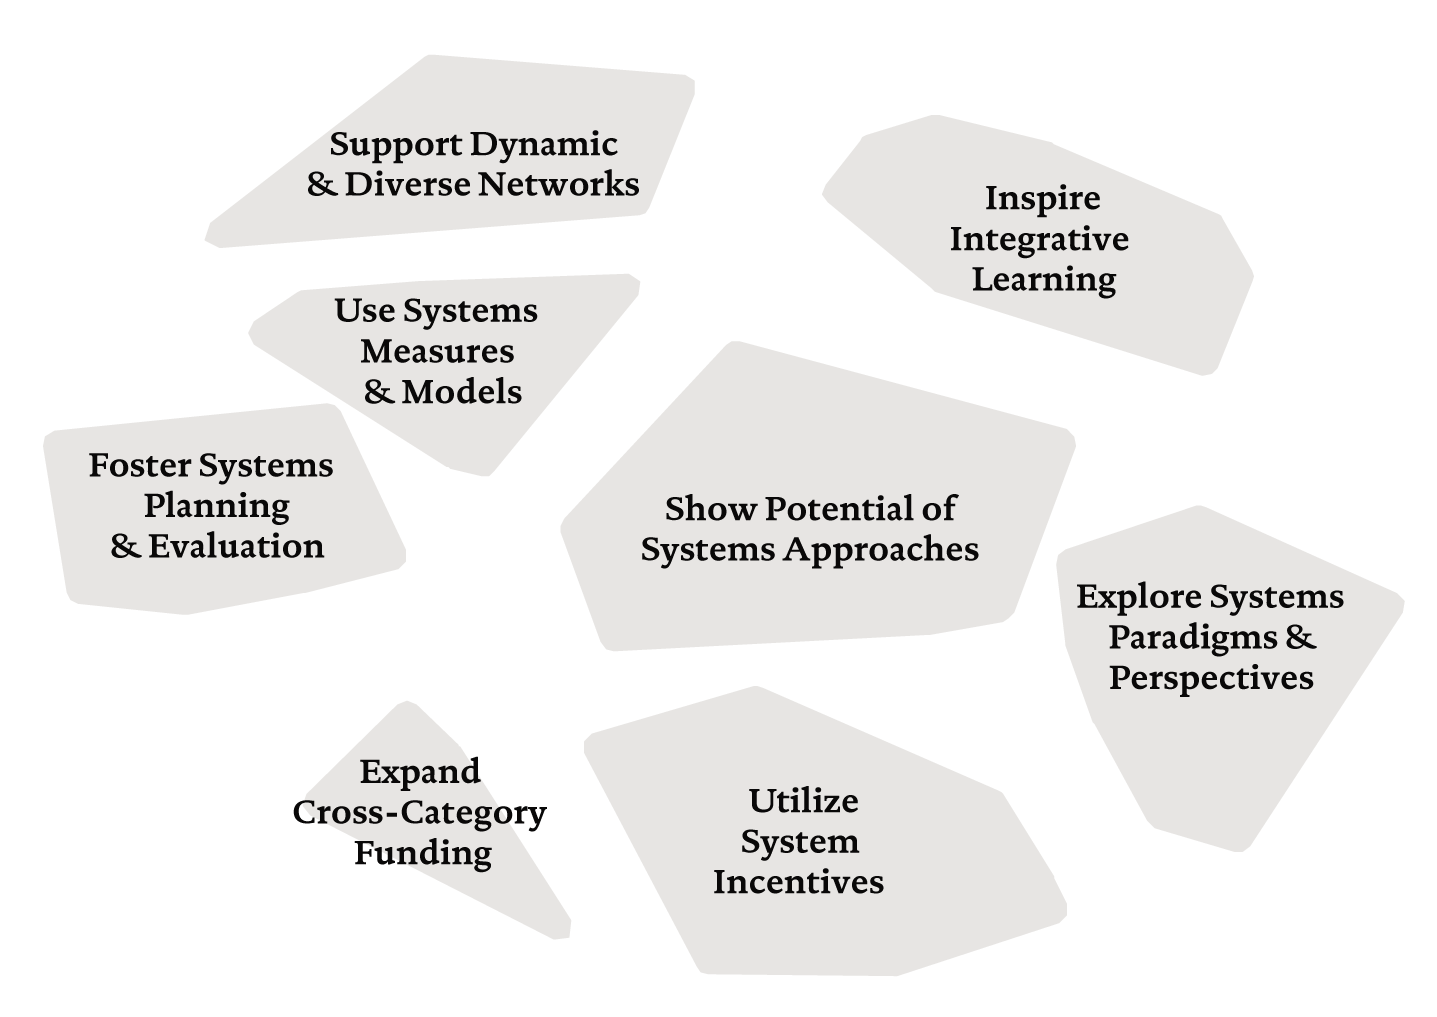
Figure 1 Eight-cluster concept map of practical challenges that needs to be addressed to encourage and support effective systems thinking and modeling in public health work
systems focus.” Foster Systems Planning & Evaluation (N=9) suggested that we integrate systems thinking and modeling into how we approach traditional planning and evaluation tasks. For instance, one statement was: “Integrate organizational planning and evaluation functions around a systems approach.” In the cluster Use Systems Measures and Models we saw statements (N=10) that relate to systems-based measurement and data collection, the use and evaluation of systems methods and models, and the development of systems tools and approaches. One statement, for example, called directly for “Development of methods and tools that encourage systems approaches in research and evaluation.” The cluster Support Dynamic and Diverse Networks contained statements (N=8) that encourage networks, collaborations, teams and partnerships that span across traditional disciplines and boundaries, and value the diversity of perspectives. An example statement was: “Use participatory action approaches to partner with communities to co-define public health problems, challenges, needs, assets, and resources.” Inspire Integrative Learning had the most statements (N=23), reflecting the fact that the topics in this cluster were most frequently brainstormed by participants. It included training and education, dissemination and diffusion of systems thinking and approaches, use of interactive and web-based resources and a broad emphasis on understanding the area of systems thinking and modeling. For instance, one of the statements in this cluster called for “A critical mass of practitioners who are able to approach public health from a nonlinear perspective,” while another called directly for “Training and education in systems research techniques for public health professionals.” Finally, the cluster in the center of the map, Show Potential of Systems Approaches (N=11), had statements related to broader demonstration of the value and impact of systems thinking and modeling. For example, one statement was: “Rigorous research that demonstrates the value of systems thinking, methods, approaches and research.” This cluster can be thought of as a central attractor in the dynamic cycle of the overall map. As the exterior clusters interact in various ways their activity converges on the central cluster where it is synthesized and disseminated, in turn exciting new activity in the exterior clusters and creating a kind of measurable ‘time step’ for each cycle.
Finally, each cluster name was carefully reverse-checked with the cluster statements to ensure that they were as adequately represented by cluster label as possible. In many cases, single words in the cluster name represent whole fields of inquiry such as integrative learning, networks, planning, evaluation, etc., and each term in the cluster name interacts with the others to modify them. Thus, the modifying effect of the term ‘systems’ on the term ‘planning’ is not merely semantic, it reflects a dramatically different paradigm from the traditional planning function. Foster Systems Planning & Evaluation, could not have been named simply ‘Foster Planning & Evaluation’, because the statements in the cluster clearly pointed toward new paradigms of planning and evaluation based on a systems perspective. The traditional sense of planning and evaluation, in which planning precedes action and evaluation follows it, does not fully characterize the statements in the cluster. Instead, the statements suggest that a major challenge to systems thinking in public health is to encourage a more systemic view of planning and evaluation. Foster Systems Planning & Evaluation suggests a form of planning that is continuous and integrated throughout with evaluation, with both encouraging evolution and adaptive learning (i.e., there is constant dynamic feedback between planning, action and evaluation).
Another good example of labeling issues is illustrated by the cluster Utilize System Incentives. The statements reflected the idea that incentives must take a systems view into account (e.g., “Reduce the overemphasis on immediate positive program impacts by taking a longer-term view”; “Address issues of politics and bureaucracy that hinder systems thinking”). Incentives that do not consider the wider systems view or the possible unintended consequences of the incentive as it perturbates through the system are not system incentives because they do not motivate the system toward the desired goal. For example, the same incentive could be placed at different points in the system and range from having either little or no effect to having profound or catalytic effects. In this way, Utilize System Incentives acts like a rule that instructs us to gain a better understanding of the basins of attraction and tipping point bifurcations of the system, and then to utilize these systems-based features as potential attractors of individual behavior, much the way that a changing environment presents new niches to which individual organisms may be attracted. In a similar manner, each of the labels was selected to convey as succinctly and thoroughly as possible the systems thinking implications of the content.
Perhaps most interesting is the notion that we can interpret this map through the lens of complex systems thinking itself. From a dynamical systems perspective, we can view the map as a collection of dynamically interacting ‘cluster agents’ each changing the behavior of the other. From a complex systems (CAS) perspective, clusters are interpreted as simple rules which, if followed, would generate self-organized emergence. We consider each of these systems-based interpretations in turn.
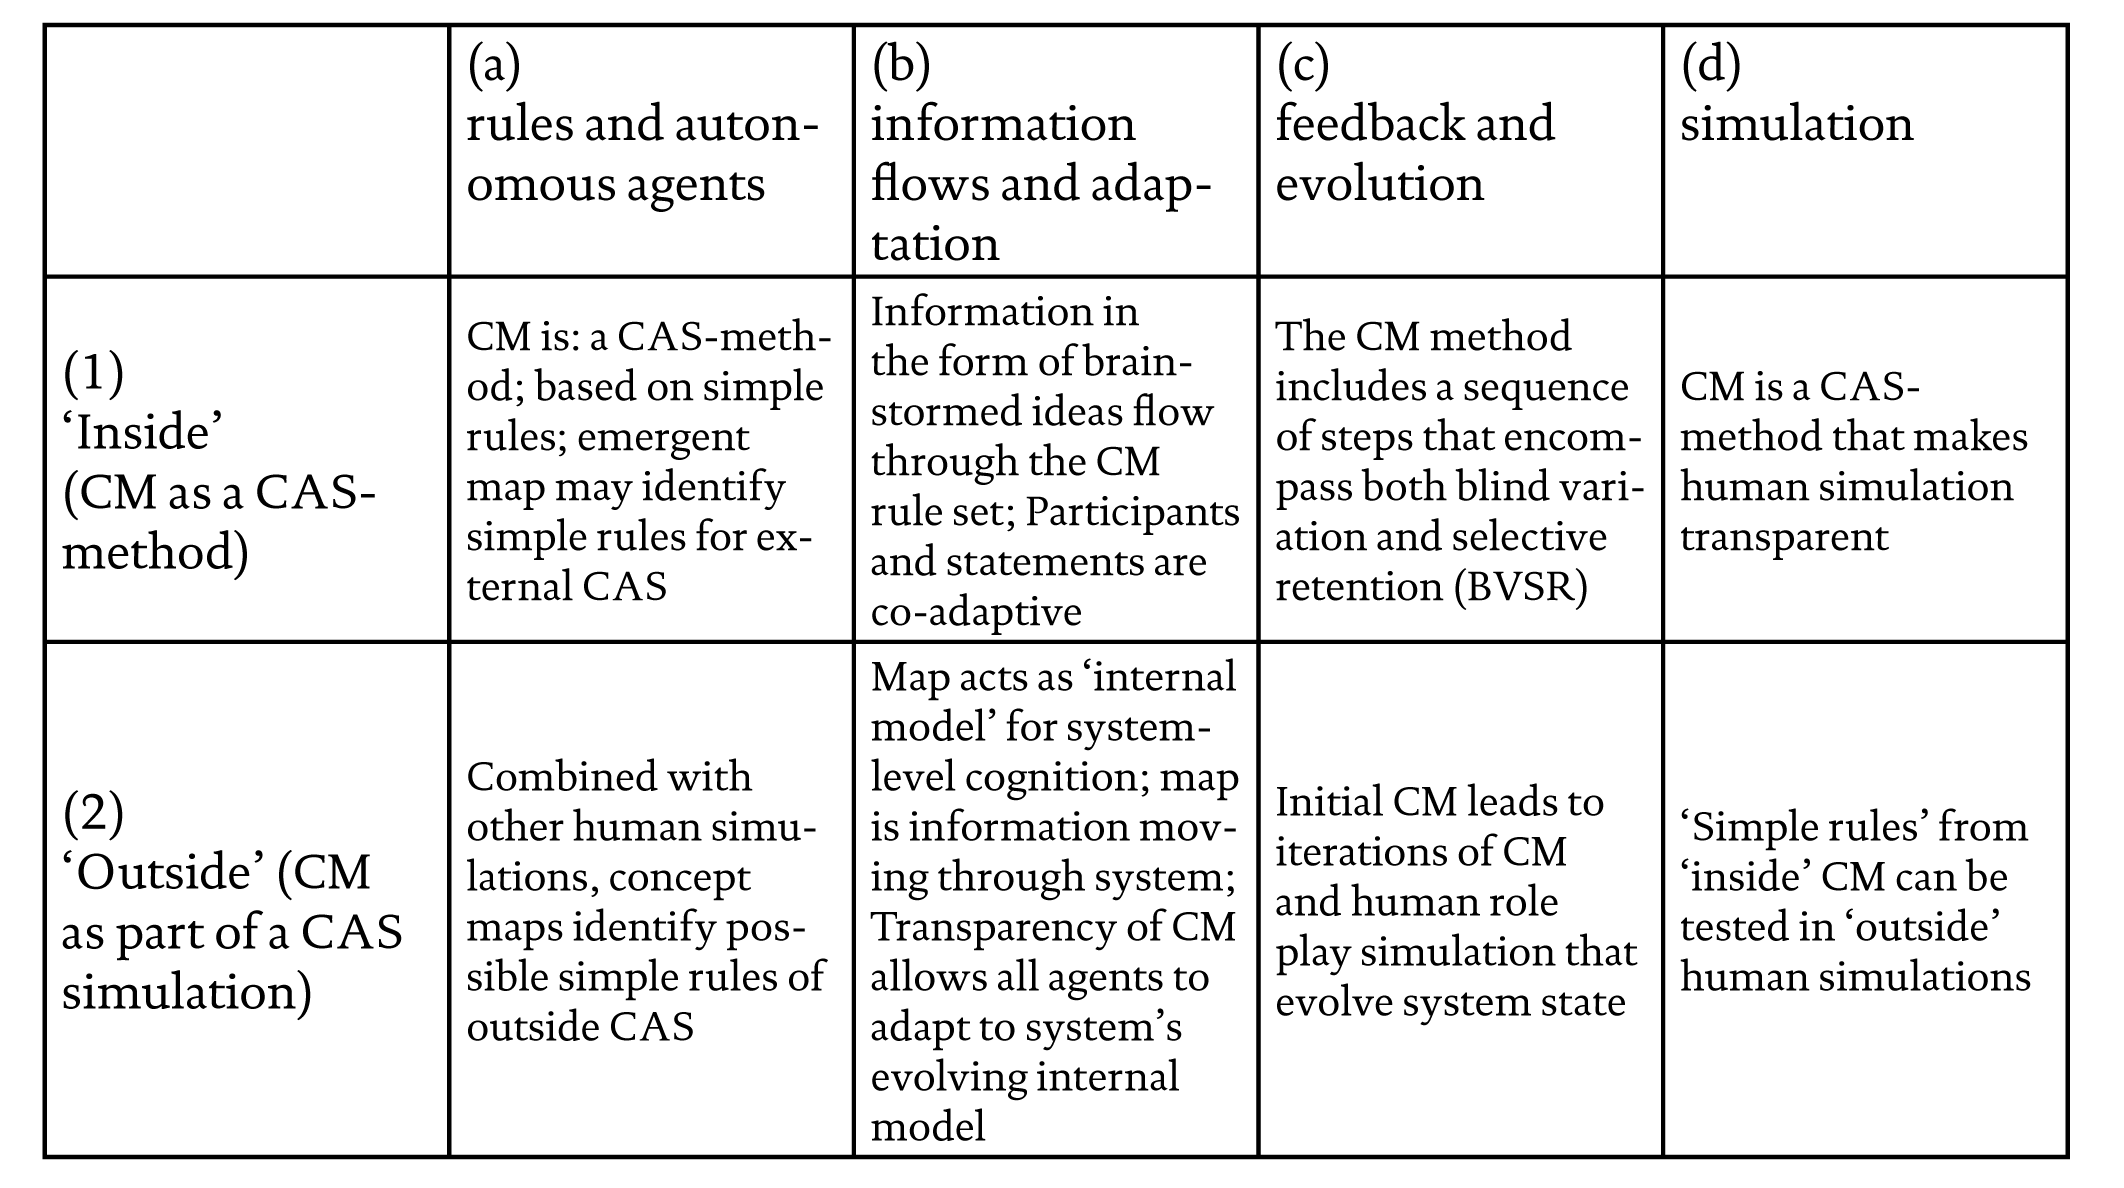
Figure 2 Concept mapping and complexity: An inside-outside model
Clusters as dynamic interacting agents
rom the perspective of dynamics, each cluster is like a semi-autonomous agent functioning in a highly integrated system, acting as a dynamically interacting conceptual or thematic ‘agent’ that influences other cluster-agents when coupled. In effect, when one cluster interacts with another cluster, they mutually affect each other. For example, when interacting with Explore Systems Paradigms & Perspectives, Inspire Integrative Learning takes on a slightly different meaning than when it is considered in connection with Use Systems Measurement & Modeling. In the former case, learning would be centered on systems paradigms and perspectives at a conceptual or epistemological level; in the latter, learning would be more formal and adaptive, using systems-based measurement and modeling to inform decision making and action. In another example, Support Dynamic & Diverse Networks interacts with Expand Cross-Category Funding to create diverse and dynamic networks of monetary flows and feedback loops. Show Potential of Systems Approaches, which contains statements relating to research, researchers and ‘best practices’ takes on a different meaning when combined with Support Dynamic & Diverse Networks; suggesting innovative notions about supporting integrative diverse networks of researchers and practitioners. The cluster-as-agent interpretation generates pairings of 56 possible tuple interactions and beyond that in even higher-order triples or n-tuples. The interpretation is dynamic because with just eight simple clusters, a diverse number of possible innovative ideas result. For example, the map might lead us to ask, what would a dynamic network of best practices in systems thinking and modeling look like? Each cluster label includes both an action and an object. The object portions of the cluster names were meant to suggest the sense that the clusters interact like structural entities—like agents. We move next to considering the action portion of each label which was included to suggest that clusters can be perceived as simple rules.
Clusters as simple rules
A second systems-based interpretation of the map is founded on the notion from the theory of complex adaptive systems (CAS) that simple local rules lead to emergent complexity. We deliberately worded each cluster label as a simple action-object rule that could be used by people engaged in public health work to encourage and manage a complex and adaptive system. In other words, each cluster label completes the prompt that was the focus for this project and constitutes a ‘practical challenge’ that needs to be addressed. The especially intriguing notion from a systems point of view is that if one follows the eight rules represented by the cluster names, emerging systems-oriented organizations and networks would result.
Complexity and concept mapping
With the example of the map in mind we turn now to the primary intent of this paper, the assessment of how concept mapping is related to complexity and how it can be applied as a method for research into human complex adaptive systems. We begin by identifying four broad themes that characterize concept mapping and correspond to major concepts in complexity: rules and autonomous agents; information flows and adaptation; feedback and evolution; and simulation. This is certainly not the only way to characterize complexity, nor is it necessarily the best. But it will serve as a device to understand concept mapping and its relationships to complexity.
We make a distinction in this paper between ‘inside’ and ‘outside’ (see Figure 2) concept mapping with respect to complexity and its major characteristics. By ‘inside’ we are referring to the concept mapping method itself (Figure 2, cell 1a-1d). We argue that the internal concept mapping process is itself a CAS. The ‘rules’ of the concept mapping algorithm—the focus prompt, brainstorming, statement synthesis, sorting and rating, statistical analysis, cluster identification, cluster naming and interpretation—produce a map that can be thought of as an emergent property of the adaptive participant actors and the methodological rule set.
By ‘outside’ (Figure 2, cells 2a-2d) we mean how a map is used instrumentally as a tool to manage an organization or policy toward some desired end while simultaneously leveraging the capacity of complex human systems to adapt and evolve. In other words, once the map emerges it is used as a discrete object by the people who developed the map, in order to better understand and/or direct organizational action or policy. This inside-outside distinction points to the fact that the concept map process (inside cas) generates a map that is useful for representing ‘simple rules’ that can then be used to enhance the human system (outside cas) and in turn to test the rules that were generated. Previously, we have had no appropriate structured empirical method that can be used to identify the ‘simple rules’ of complex human systems. Concept mapping and its processes and algorithms have the potential to accomplish just that. Thus, while rules and agents, information flows and adaptation, simulation, and feedback and evolution are all characteristics of the concept mapping method (e.g., ‘inside’—Figure 2, cells 1a-1d) they can also be used to characterize the application of the results of this method (e.g., a map) to stakeholders ‘outside’ of the participant group (Figure 2, cells 2a-2d). In the discussion that follows, we will explore some of the relevant ideas in the study of complex systems and apply them to both inside and outside applications of concept mapping.
Rules and agents
The concept mapping process involves free listing or brainstorming based on a focus prompt, unstructured sorting and rating of ideas, and the generation of maps using a sequence of statistical analyses (multidimensional scaling and hierarchical cluster analysis) that the participants or agents then interpret. From an instrumentalist perspective, concept mapping itself is a complex adaptive system (Figure 2, cell 1a). It is sensitive to the initial conditions of the focus prompt. It engages multiple independent agents who follow a simple set of rules that lead to the emergence of a map. In this regard, concept mapping, both inside and outside, encourages diversity (Holland, 1995, 1998) because it fosters the free flow of disparate ideas into aggregations and because it is participatory, allowing diverse groups of agents to adapt to a shared set of ideas (Figure 2, cells 1b and 2b). In terms of process, the rules are to brainstorm, sort, rate, and label or name the emergent map structures. On the analytic side, the rules are constituted in the manipulations of the sequence of statistical procedures that includes at its center multidimensional scaling and hierarchical cluster analysis. (These statistical procedures also involve simple rules and data that act like agents, although in the case of MDS, for example, there are no adaptive or emergent properties of the data. In other words, the same data will always produce the same results.)
Information flows and adaptation
Much of what occurs in complex systems is based on the flow of information through the system (Cabrera, 2002) and the subsequent adaptations made by agents in response to these changing flows (Holland, 1995). Whether the flow is a physical process that carries information as energy (e.g., quarks and atoms), chemical processes (e.g., pheromones) that carry information between one organism and another, biological material (e.g., DNA) that carries information across generations, technology (e.g., bits and bytes) that carries information from one computer to another, or psycho-social communications that carry information from one person to another, the central idea is that agents and systems adapt to changing information flows. At various points in the concept mapping process, individual agents adapt to the changing flow of ideas. In the brainstorming phase, agents are adapting to the synchronous or asynchronous generation of new statements based on a focus prompt. In the cluster naming phase, individual agents or actors are adapting to suggested labels for emergent clusters. At a larger scale, the system itself adapts to the new information provided by the completed map, a snapshot or internal model of the system’s cognitive state at a given point in time. At the next time step, the system responds to this ‘snapshot’ by adapting to the information it contains.
Hypothetically, one can imagine a ‘string’ of concept maps linking one time step to another in which each snapshot informs the next action in much the same way as the evolving cognition of an individual results in adaptive changes to their behavior. In the longer time horizon of an organization, the system is cognitively evolving and adapting at the system level, rather than merely at the actor or agent level; in other words, as the individuals adapt and follow simple rules to generate an emergent map, the map itself informs the new behaviors of the individuals in the system. So, while the individual behavior results in a map that represents the system’s cognitive state, the system’s cognitive state informs the next evolution of individual behavior, and so on. This process of ‘linked’ concept mapping can be thought of as a dissipative structure (Nicolis & Prigogine, 1989) in which agent interaction and information flow move through a state space that is in constant flux, but maintains its essential structure and function. A map emerges that constitutes a snapshot of this dissipative structure over an extended time scale that feeds back to the agents who generated it, changing their thinking and constituting a comprehensible representation that they can use instrumentally and around which they can interact.
To concretize some of these ideas, consider again the example map in the systems in public health study. The agents (members of the ISIS and Syndemics initiatives) engaged in a simple rule process that led to an emergent map at time step 1 (t1). The t1 map is then fed back into the system of people who generated it. Because the system of individuals, not each individual, generated clusters and ratings for certain statements that were more cohesive or more important than others and because these clusters and ratings are different as a whole from any of the individual ratings and clusterings, the map that emerged is different than any one of the maps that might be generated by a single individual. In t2, when the map is provided for review, the individuals in the system will interact with this new information; they will have a better understanding of the various system components, the relative importance of certain statements over others and the ways in which the system collectively organized the statements into clusters. In other words, the map will act as an internal model (Holland, 1995) for the system as a whole. Based on this new information, the individual actors will adapt their own perceptions and actions within the system. If another concept mapping project occurs in t3, a new map emerges at t4 that will be different than the map generated at t1. We can say that the system’s thinking, represented by the map, has evolved. In particular, one of the ways the map evolved is that the concept mapping process in t0 and the emergence of the map in t1 illustrated some of the attractor basins and flows in the system and that the emergence of the map at t3 and t4 reflected the combined effects of those attractors. In simple terms, having seen the ways in which the system structures self-organize, individuals will benefit from and adapt to these structures by reinforcing them or changing them in some way. An individual in the system will be better able to understand how their thinking and the system’s structure are similar or different and can adapt accordingly.
When the simple rules of concept mapping are implemented, complexity and adaptation are encouraged. The sensitivity to initial conditions (SIC) that is characteristic of chaotic systems exists in the sensitivity of concept mapping research on the initial focus prompt. A great deal of expertise and care must be given to the selection of an adequate focus prompt. Yet, even the same focus prompt can yield dramatically different maps due to the complex adaptive nature of the process itself. Following simple rules of brainstorming, synthesis, sorting, rating, and cluster identification and naming, each map is an emergent property of the dynamics of the system.
Feedback and evolution
Throughout, the concept mapping process generates feedback across participants and a blind variation (brainstorming) and selective retention (statement synthesis, cluster identification, prioritization of ‘attractor’ topics) of ideas (Figure 2, cells 1c and 1d). This ‘two-step’ process (Cabrera, 2002) is evocative of Campbell’s ‘evolutionary epistemology’ or selection theory in general (Campbell, 1991) or Blind Variation Selective Retention (BVSR) theory in particular with clear ties to the biological theory of evolution (Cabrera, 2002). The concept mapping process is evolutionary in two distinct ways. The first is the BVSR that occurs ‘inside’ (Figure 2, cell 1c) the concept mapping research (e.g., between brainstorming (BV) and the selective retention (SR) of synthesis, cluster identification, etc.). An evolutionary process also occurs ‘outside’ (Figure 2, cell 2c) the research project when completed maps, which are themselves generated by the system under study (e.g., the people in the study), are used by the system to inform itself and to take continued action. In the outside application, concept maps act as internal models for system cognition (Figure 2, cell 2b) and individual actors will adapt their behavior to this internal model. In other words, the map itself, is a group feedback mechanism similar to the feedback loop one creates in self reflection. The self reflects on its state and develops a description (an internal model) of that state that is then used to take action and alter the state. In turn, this internal model leads to longer lasting ‘building blocks’ that are then used when encountering future scenarios (Holland, 1995). Concept mapping as a process is a group version of this type of reflective and adaptive feedback loop. The map itself, the emergent property of another closed CAS, is then used as a feedback mechanism for the larger system that created it.
Simulation
Concept mapping can also be thought of as a type of ‘human simulation’ for complex social systems that is analogous to more traditional computational simulations that are currently used in CAS. Just as in computational simulations, small changes at different points in the concept mapping process can lead to dramatically different emergent results. These traditional computational simulations are at this point largely incapable of adequately modeling systems involving humans and ideas. For example, while computational simulations have been successful in modeling ant colonies, traffic flow patterns, and urban development (Johnson, 2001), they have yet to demonstrate utility in modeling complex social interactions such as managing organizations or how a particular group perceives its predicament. Concept mapping provides a potentially useful method for such areas.
As one form of human simulation, concept mapping can effectively be combined with other forms of simulation such as role playing or scenario gaming to formalize the experience of the actors in the simulation and better understand the complexity in the attendant systems. Studies that combine concept mapping with role play simulations have great potential for enhancing our understanding of complex social and organizational systems constituted of people, their ideas and their actions. The systems thinking in public health study described above provides a good context where such research might be undertaken and how it might proceed. In the public health study, the concept mapping method (inside) was used to generate a candidate list of ‘simple rules’ that can be used to manage systems thinking efforts in complex public health systems. Having developed this ‘inside’ map, it can be used as the basis of a role playing simulation designed to test how the simple rules outlined in the map might play out in a hypothetical real-world context.
For example, a simulation might be constructed around the idea of developing a new multi-organizational public health network for tobacco control. A diverse range of actors (e.g., policy makers, funders, practitioners, researchers, community members) could be identified, with each one given a script of basic stages in the development of the network and specific roles or parts that they can play at each stage. The role play simulation could take place over the course of a multi-day meeting where the group works through the first year in the development of the network in a series of sessions that represent time-steps. Different actors would, according to script, have subgroup meetings as the network evolves, while at other times the whole group might convene. The scripts would be relatively loose, describing the role the actor is to play and specific ‘rules’ they should keep in mind as they play it (with the rules derived from the map). Thus, while the whole simulation would be structured, the actors would be free within the constraints of their roles to make things up as they go along. Based on incoming (and imperfect) information, actors would make local decisions that would in turn be transmitted to other groups involved in the simulation, and the group as a whole. The facilitators could adapt the nature of each round of instructions of the simulation depending on the results of the previous time-step. By evaluating how the role play proceeds, it would be possible to assess how well the rules influence the emerging system. It would also be possible to study the implications of different rules in a more controlled fashion. In the simplest sense, one could conduct two independent simulations, one just allowing people to follow roles and adapt as they see fit, the other instructing various actors to use simple rules identified through the mapping. A comparison of what emerges would illustrate the impact of the rules. In similar fashion, comparative simulations would enable contrasting of different rules and combinations of rules to explore their implications and potential real-world implications. Just as algorithmic computational simulations are currently important in complexity science, the coupling of concept mapping to identify rules for a human role play simulation could potentially provide an analogous simulation laboratory for exploring complexity in social systems.
Conclusions
This paper illustrates the potential utility of concept mapping as a CAS-method for research on human complex systems. While there are many new CAS-methods for studying physical, chemical, and biological systems and fewer to study simpler social systems (such as small world networks, traffic patterns, and urban design), there are surprisingly few methods that are useful in studying the most complex human systems comprised of people and their ideas. Without such methods, it is difficult to gain any purchase on the complex interactions that make up human organizations and their social environments. Concept mapping, as a CAS-method, allows the researcher to assemble a diverse group of participants with a broad array of ideas on a topic and to generate an emergent map that may then serve as an internal model for the system itself. Combined with other forms of human simulation, this map can then be used to test certain rule structures with the hopes of eventually identifying a ‘human algorithm’ for directed, purposive organizational action. In this sense, the concept mapping method occupies a unique position relative to its methodological peer group and relative to complexity.
One important concern that remains to be addressed is whether use of methods like concept mapping may lead to the negative consequences associated with the idea of ‘groupthink’ (Janis, 1972, 1982). Groupthink occurs when groups resist divergent thinking and, because of their desire for consensus, do not consider a broad range of alternatives in decision making. The structured and participatory nature of concept mapping, the independent and anonymous involvement at various steps, and the blind variation that occurs at several points in the process make it difficult for the group to force consensus unless it exists independent of efforts to create it. The influence of systems attractors in the concept mapping process is no different than the influence of these same attractors in everyday activities except that in concept mapping they become transparent to the system and its actors. Where concept mapping is different is that it provides a systemic and formalized research tool for understanding these systems effects and for making this understanding publicly available. The mapping process, in effect, helps to make the system more transparent to the actors within the system. In many cases, this transparency can be effective in pointing out conformity pressures and power disparities such as minority control (Trochim, 1989a). The diversity and participatory nature inherent in the concept mapping method as well as the transparency effects of the emergent map in fact make concept mapping an effective counter-method for groupthink.
Concept mapping essentially turns the traditional modeling and simulation of CAS on its head; whereas CAS simulations usually involve independent cellular automata that operate under simple rules and lead to adaptivity and emergent phenomena, in the internal case of concept mapping, the emergent property is a set of rules for the system. These rules were derived from a process based on what can be termed the ‘meta rules’ of the concept mapping method. We have a map that is itself emergent from the CAS of the mapping process inductively identifying candidates for implicit simple rules in the system that, if consciously and coherently applied, may lead to greater creativity (blind variation), emergence and adaptation (selective retention). In this regard, concept mapping as a method helps us to identify candidates for simple rules of a complex human system. In turn, using the concept map in combination with other human simulations, these candidate rules may be tested and validated, and the results used to revise and adapt the rules.
References
Adams, J. L. (1979). Conceptual blockbusting: A guide to better ideas, 2nd edition, New York, NY: W. W. Norton & Company, Inc. ISBN 0393950166.
Best, A., Tenkasi, R. V., Trochim, W. T., Lau, F. Y., Holmes, B., Huerta, T. R., Moor, G., Leischow, S. and Clark, P. I. (in press). “Systemic transformational change in tobacco control: An overview of the Initiative for the Study and Implementation of Systems (ISIS),” in A. Casebeer, A. Harrison and A. E. Mark (eds.), Innovation in health care: A reality check, Houndmills, UK: Palgrave MacMillan.
Biegel, D. E., Johnsen, J. A. and Shafran, R. (1997). “Overcoming barriers faced by African-American families with a family member with mental illness,” Family Relations, ISSN 01976664, 46(2): 163-178.
Cabrera, D. A. (2002). “Patterns of knowledge: Knowledge as a complex, evolutionary system, an educational imperative,” in R. Miller (ed.), Creating learning communities, online edition, Brandon, VT : Solomon Press, ISBN 1885580045.
Campbell, D. T. (1991). “Autopoietic evolutionary epistemology and internal selection,” Journal of Social and Biological Structures, ISSN 01401750, 14(2): 166-7.
Concept Systems Incorporated (2004). The concept system, Version 3.0, Ithaca, NY: Concept Systems Incorporated.
Coxon, A. P. M. (1999). Sorting data: Collection and analysis, Thousand Oaks, CA: Sage, ISBN 0803972377.
Daughtry, D. and Kunkel, M. A. (1993). “Experience of depression in college-students: A concept map,” Journal of Counseling Psychology, ISSN 00220167, 40(3): 316323.
DeRidder, D., Depla, M., Severens, P. and Malsch, M. (1997). “Beliefs on coping with illness: A consumer’s perspective,” Social Science and Medicine, ISSN 02779536, 44(5): 553559.
Donnelly, K. Z., Donnelly, J. P. and Grohman, K. J. (2000). “Cognitive, emotional, and behavioral problems associated with traumatic brain injury: A concept map of patient, family, and provider perspectives,” Brain and Cognition, ISSN 02782626, 44(1): 21-25.
Everitt, B. (1980). Cluster analysis, 2nd edition, New York, NY: Halsted Press, ISBN 047026991X.
Greene, J. C. and Caracelli, V. J. (1997). “Advances in mixed-method evaluation: The challenges and benefits of integrating diverse paradigms,” in J. C. Greene and V. J. Caracelli (eds.), New directions for program evaluation, San Francisco, CA: Jossey-Bass, ISBN 0787998222.
Holland, J. (1995). Hidden order: How adaptation builds complexity, Reading, MA: Perseus Books, ISBN 0201407930.
Holland, J. (1998). Emergence: From chaos to order, Reading, MA: Addison-Wesley, ISBN: 0201149435.
Jackson, K. and Trochim, W. (2002). “Concept mapping as an alternative approach for the analysis of open-ended survey responses,” Organizational Research Methods, ISSN 10944281, 5(4): 307-336.
Janis, I. (1972). Victims of groupthink, Boston: Houghton Mifflin, ISBN 0395140021.
Janis, I. (1982). Groupthink: Psychological studies of policy decisions and fiascos, 2nd edition, Boston: Houghton Mifflin, ISBN 0395317045.
Johnsen, J. A., Biegel, D. E. and Shafran, R. (2000). “Concept mapping in mental health: Uses and adaptations,” Evaluation and Program Planning, ISSN 01497189, 23(1): 67-75.
Johnson, S. (2001). Emergence: The connected lives of ants, brains, cities, and software, New York: Scribner. ISBN 068486875X.
Krippendorf, K. (2004). Content analysis: An introduction to its methodology, 2nd edition, Newbury Park, CA: Sage Publications, ISBN 0761915451.
Krugman, P. (1996). The self-organizing economy, Oxford, UK: Blackwell Publishers, ISBN 1557866996.
Kruskal, J. B. and Wish, M. (1978). Multidimensional scaling, Beverly Hills, CA: Sage Publications, ISBN 0803909403.
McKelvey, B. (1999). “Complexity theory in organization science: Seizing the promise or becoming a fad?” Emergence, ISSN 15213250, 1(1): 5-32.
Milstein, B. (2004). “Syndemics,” in Encyclopedia of evaluation, Beverly Hills, CA: Sage Publications, ISBN 0761926097.
Nagasundaram, M. and Alan, D. (1993). “When a group is not a group: The cognitive foundation of group idea generation,” Small Group Research, ISSN 10464964, 24(4): 463-489.
Nicolis, G. and Prigogine, I. (1989). Exploring complexity: An introduction, New York, NY: W. H. Freeman, ISBN 0716718596.
Osborn, A. F. (1948). Your creative power: How to use your imagination to brighten life, to get ahead, New York, NY: Scribner, ISBN 0684129671.
Philipsen, G., Mulac, A. and Dietrich, D. (1979). “The effects of social interaction on group idea generation,” Communication Monographs, ISSN 03637751, 46: 119-125.
Resnick, M. (1994). Turtles, termites, and traffic jams: Explorations in massively parallel microworlds, Cambridge, MA: MIT Press, ISBN 0262181622.
Rosenberg, S. and Kim, M. P. (1975). “The method of sorting as a data gathering procedure in multivariate research,” Multivariate Behavioral Research, ISSN 00273171, 10: 489-502.
Shern, D., Trochim, W. and Christina, L. (1995). “The use of concept mapping for assessing fidelity of model transfer: An example from psychiatric rehabilitation,” Evaluation and Program Planning, ISSN 01497189, 18 (2): 1442-153.
Southern, D. M., Young, D., Dunt, D., Appleby, N. J., and Batterham, R. W. (2002). “Integration of primary health care services: Perceptions of Australian general practitioners, non-general practitioner health service providers and consumers at the general practice-primary care interface,” Evaluation and Program Planning, ISSN 01497189, 25(1): 47-59.
Trochim, W. (1989a). “Concept mapping: Soft science or hard art?” Evaluation and Program Planning, ISSN 01497189, 12(1): 87-110.
Trochim, W. (1989b). “An introduction to concept mapping for planning and evaluation,” Evaluation and Program Planning, ISSN 01497189, 12(1): 1-16.
Trochim, W. (1993). “The reliability of concept mapping,” paper presented at the Annual Conference of the American Evaluation Association, Dallas, TX., November 6, 1993.
Trochim, W., Cook, J. and Setze, R. (1994). “Using concept mapping to develop a conceptual framework of staff’s views of a supported employment program for persons with severe mental illness,” Journal of Consulting and Clinical Psychology, ISSN 0022006X, 62(4): 766-775.
Trochim, W., Stillman, F., Clark, P. and Schmitt, C. (2003). “Development of a model of the tobacco industry’s interference with tobacco control programs,” Tobacco Control, ISSN 09644563, 12: 140-147.
Weller, S. C. and Romney, A. K. (1988). Systematic data collection, Newbury Park, CA: Sage Publications, ISBN 0803930739.
White, K. S. and Farrell, A. D. (2001). “Structure of anxiety symptoms in urban children: Competing factor models of the revised children’s manifest anxiety scale,” Journal of Consulting and Clinical Psychology, ISSN 0022006X, 69(2): 333-337.