Introduction
In recent years, the youth agricultural organizations FFA and 4-H have both faced declining enrollment and membership (Hoover and Scanlon, 1991; Talbert and Balschweid, 2004). This may in turn have widespread effects on local, state, and national chapters and programs through potential losses in chapter funding, lowered teacher salaries due to reduced responsibilities, fewer new position openings, and decreased support and maintenance to current programs (Hoover and Scanlon, 1991). Previous studies on enrollment and retention issues in FFA and 4-H have shown that contributing factors for not joining agricultural youth programs include peer influence, lack of time or money, and lack of student interest, as well as a negative image of the organizations and/or the agricultural industry (Croom and Flowers, 2001; Hoover and Scanlon, 1991; Stoller and Knobloch, 2005; Talbert and Balschweid, 2004).
While image has long been adduced as a key factor in reduced participation in agricultural youth programs, other factors may also be significant. Larson and Seepersad (2003), in investigating the different ways in which American adolescents spend their leisure time, found that 40—60 percent of high-school students are employed part time, an average much higher than found in other countries. The amount of time spent working after school results in less time that the students could dedicate to other pursuits (Larson and Seepersad, 2003). On average, 40—50 percent of boys’ and girls’ daily time is considered free time; the other half is dedicated to chores, jobs, and schoolwork. Of the proposed free time, unsupervised free time is thought to be the riskiest time when adolescents may engage in delinquent behaviors (Riggs and Greenberg, 2004; Roffman et al., 2001). In comparison, adolescents may choose to utilize their free time to participate in the over 400 national, or tens of thousands of local, structured youth programs (Larson and Seepersad, 2003). Agricultural youth programs are just one option among many school, community, religious, and sport-based youth activities, and therefore must compete for members. Regardless of the type or purpose of youth organizations, the question of how to recruit and retain members remains of high importance.
An additional challenge facing agricultural youth programs is the changing student demographic. The original purpose of agricultural youth organizations such as FFA and 4-H was to establish a place for agriculture in public schools and provide learning experiences that would improve farming techniques and practices (Brown, 2002). For much of the history of the FFA, the “typical” demographics of agricultural students, and subsequent FFA members, were white males from a farming background. In 1989, however, recommendations to change the image of the FFA to one appealing to all students interested in agriculture were implemented and have expanded today’s FFA members to include a mix of youth from various upbringings, ethnicities, and gender (Hoover and Scanlon, 1991). However, while a study on minority enrollment in Ohio 4-H programs reported that minority youth have a faster growth rate than non-minority youth and account for one-third of the total youth in America, minority membership in agricultural youth organizations has continued to decline (Cano and Bankston, 1992; U.S. Census Bureau, 2003; Wakefield, 2003). In general, agricultural youth organizations are finding it harder and harder to recruit and retain a diverse range of students, whether due to competition on time, interest in the subject matter, or other factors.
Several attempts have been made to model the emergence and evolution of non-profit organizations with agent-based models: Smith (2004) suggested using complexity theory to model the evolution of sports organizations in Australia; Moldoveanu (2004) introduced a quantitative agent-based model to study the complexity in organizations, and Fioretti and Visser (2004) added a theory of decision making to such models. While the above models do describe complex structures in organizations, much less attention has been given to the dynamics of organizational change (McKelvey, 2004). However, recently agent-based models have been used to illustrate that a sequence of symmetry breakings from the largest to the smallest scales leads to phenomena that are typically described with the phrase “the whole is more than the sum of the parts” (Hubler, 2005). Also, physical implementations of agent-based systems shows the growth of emergent, fractally structured hierarchies (Jun and Hubler, 2005).
In this paper we use an agent-based model to study the dynamics of participation in an organization, particularly with regard to the impact of youths possessing leadership skills. We assume that all agents are subject to peer pressure, with the amount of peer pressure being a system parameter. Furthermore, we assume that youths with leadership skills can generate a larger degree of peer pressure. First, we study populations with no pronounced leaders and determine the participation and appreciation of the organization as a function of incentives. Incentives can be described as the factors that may lead to participation or non-participation. Such factors may include marketing, peer participation, role-modeling behaviors, and suggestions from trusted sources. We do not differentiate between the incentives given by family, teachers, and counselors, but consider only the total amount of incentives. However, we do consider the fact that the individuals have different personal situations and therefore have different barriers for participating. Then we study the impact of leadership among the youth. Finally, we explore a situation where the incentives are slowly increased or decreased to determine effects on participation.
An agent-based model of a social network
Participation in a youth organization is considered to be a function of the leadership skills of the youth and peer pressure. We consider a group of M agents. We model the level of participation of each agent in the youth organization during the nth business cycle. We assume that the rate at which the participation increases depends on the current participation and the peer pressure. The participation during the next business cycle is proportional to the participation in the current business cycle, where the proportionality constant is called appreciation. Peer pressure increases the participation as well. Further, we assume that the participation is subject to some random fluctuations.
The peer pressure depends on the participation levels of the other agents and increases exponentially with the difference in leadership skills between the agents. A leader is a person who acts as a role model for other youth. The quantity S measures the strength of the interactions between the agents. For S = 1/(M—1) peer pressures in the network are very high. In contrast, for S=0 this model describes a group of individualists who do not respond to peer pressure. Hence S is a measure of the peer pressure in the system. Further, we assume that the appreciation decreases when the participation reaches 100%, due to time constraints, money constraints, and so on. We use the logistic map to model such diminishing returns.
The personal situation of each agent is considered to be slightly different. For instance, a student from a farming background may see more value and relevance to participation in an agricultural youth organization than a student from a non-farming background. Also, for each agent there is a different barrier to participation in the organization. Positive experiences and the quality of the program contribute to the appreciation of the organization, which is also increased by incentives. Hence we assume that the appreciation during the current business cycles is proportional to the appreciation in the previous business cycle. It is also affected by the participation, the personal situation of the agent, and the net effect of incentives provided by the youth organization, teachers, parents, and other advocates.
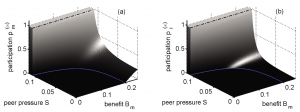
The?participation?of?the?agent?with?the?smallest?barrier
(a) and the other agents (b), versus the benefit of the agent with the smallest barrier and versus the peer pressure. Only if the benefit for at least one agent exceeds a threshold (blue line) do the agents participate. The threshold is smaller for larger peer pressure. If the peer pressure is very large (beyond dashed line) then the participation of all agents is 100% if at least one agent has a benefit from participating.
Average-quality youth groups with no strong leaders
First we study the consequences of peer pressure in an average-quality youth program with no strong leaders. If the net incentive is small, only the agent with the smallest barrier develops a positive attitude in which the agent’s participation and appreciation of the program approach a stable fixed point; that is, over time the participation of the agent approaches a constant value.
If the incentive is smaller than the smallest barrier, the limiting appreciation of all agents is zero. Consequently, none of the agents will participate. However, if the incentive is between the lowest barrier and the second lowest barrier, then the limiting appreciation of that agent is greater than zero. Nevertheless, the participation of the agents is still zero. Only if the benefit, which is the difference between the incentive and the lowest barrier, exceeds a certain threshold will a bifurcation occurs; that is, in the following situations:
If the peer pressure S is large, then the limiting participation of all agents jumps from zero to 100%.
If the peer pressure S is small, then the limiting participation of all agents increases gradually to 100%.
Despite the fact that the appreciation of the other agents is zero, they start to participate due to the peer pressure. Figure 1 shows the limiting participation versus the benefit of the agent with the smallest barrier and versus the peer pressure for a network M = 10 agents for the agent with the smallest barrier (a) and the other agents (b). If the incentive is less than the threshold indicated by the continuous blue line, then the limiting participation is zero for all agents. If the peer pressure exceeds the threshold, indicated by the dashed line, then the participation of all agents is equal to one.
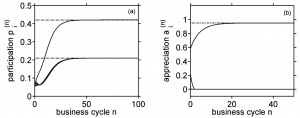
Figure 2 shows the time dependence of a system with 10 agents with random barriers. The peer pressure is high, but below the threshold. For this set of barriers, agent 6 has the lowest barrier. For this parameter set agent 6 is the only agent that has a positive benefit. Figure 2 shows that agent 6 is the only agent that develops a positive appreciation. The top curve is the participation of the agent with the lowest barrier; the lower curves are the participation levels of all other agents. The dashed lines are the theoretical values (see mathematical appendix).
The?participation?and?appreciation?of?the?organization?versus?time
The top curve is the participation of the agent with the lowest barrier; the lower curves are the participation levels of all other agents. The other agents do not appreciate the organization but participate somewhat because of peer pressure.
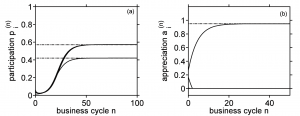
The?participation?and?appreciation?versus?time?for?a?system?with?a?strong?leader
The lower curve is the participation of the leader, the upper curves are the participation levels of all other agents. The other agents participate more than the leader, due to peer pressure, despite the fact that they do not appreciate the organization. The dashed lines are the theoretical values.
Average-quality youth groups with strong leaders
Next, we consider the impact of leadership. We consider a system where the agent with the smallest barrier is also a strong leader, and the system is an average-quality youth program.
If the incentive is smaller than the smallest barrier, then the benefit is negative for all agents, and the limiting appreciation of all agents is zero as well. However, if the incentive is between the lowest barrier and the second lowest barrier, then one agent has a positive benefit and the fixed point appreciation of that agent is greater than zero, whereas the appreciation level of the other agents is still zero. In the following we will consider this case. Since that agent is the only agent with non-zero appreciation, we treat it separately from the other agents.
Figure 3 shows the time dependence of the participation and the appreciation of a system with ten agents where the parameters are the same. The exception being that agent 6 has a large leadership level. Agent 6 is the only agent which develops an appreciation. The limiting participation of agent 6 does not depend on leadership skills as long as the participation of the other agents is less than one, but the limiting participation of the other agents do increase if the leadership of agent 6 increases. The lower curve is the participation of the agent with the lowest barrier; the upper curves are the participation levels of all other agents. The dashed lines are the theoretical values.
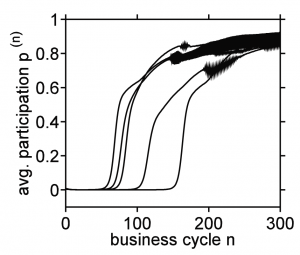
The?average?participation?versus?time?for?five?different?sets?of?agents
Despite the fact that the incentives grow at a constant rate, the average participation changes suddenly and at a different time. Even if the benefit exceeds the threshold for participation, it takes a long time before this translates into a significant participation and noise determines when the participation grows rapidly. If there is a large amount of noise in the participation dynamics, these delays are much shorter.
Systems with slowly changing incentives
Next, we consider the situation where the incentives are changing slowly, and determine the average level of participation. Figure 4 shows a numerical simulation of a social system where the net incentive increases very slowly, starting from zero. All other parameters are as in Figure 2. We find that the average participation changes suddenly. As soon as the agent with the lowest barrier starts to participate, a second-order phase transition occurs. This phase transition may be less pronounced if the system is less social; that is, if the peer pressure is small.
We find that the participation starts to grow if the benefits of one of the agents are positive. However, if the noise level is small, it may take many time steps before the growth in participation becomes noticeable. For small noise levels there is a significant delay between the time when the limiting participation becomes positive and the time when the participation is actually significantly different from zero. This means that the participation may stay zero for a long time, unless a youth participates accidentally in the youth organization. We conclude that the larger the accidental participation, the faster the growth of the youth organization. Even if the potential for growth is there, the organization may not grow unless there are significant accidental fluctuations in participation.
Discussion
We studied the impact of one individual on the behavior of a social network of people. We found that peer pressure can induce sudden unexpected changes in the behavior of a group. Figure 1 shows that the participation stays zero unless the benefits exceed a threshold, the threshold being some individual level of an agent’s participation. Figure 4 shows that these sudden changes may occur after a long delay. The length of the delay depends on the noise in the system. Further, we find that the individual with the largest benefit dominates the group behavior. If that individual happens to have a leadership role, the impact is particularly strong. In addition, we find that incentives targeting leaders are more effective than unspecific incentives. Since youth organizations are typically organized in small local groups, we expect these groups to grow suddenly if incentives target youths who are likely to participate and have leadership skills. Similarly, we expect these groups to disappear suddenly unless incentives target such youths. We expect both the growth and disappearance of these local groups to occur rather unexpectedly long after the incentives have changed.
Mathematical appendix
We consider a group of M agents. We model the level of participation of agent i in the youth organization during the nth business cycle, where n = 0, 1, .... The participation of agent i during the next business cycle is a function of the current participation and the peer pressure, the participation dynamics is assumed to be pi(n+1) = bi(n) pi(n) + Pi(n) + r(n), where i = 1, 2, ..., M. pi(n) is the level of participation of agent i in the youth organization during the nth business cycle. bi(n) is the appreciation factor of that agent. Pi(n) is the peer pressure on agent i. The level of participation is between 0% and 100%, i.e., 0 = pi(n) = 1. We assume that the participation is subject to some random fluctuations. This is modeled by the term r(n). r(n) are small random numbers that are equally disrupted between -r and r, i.e., where 0 = r = 1. The following equations states that the peer pressure on agent i at time step n from other agents depends on the participation levels of the other agents and increases exponentially with the difference in leadership skills between the agents; Pi(n) = S p1(n) exp(L1-Li.)+ S p2(n) exp(L2-Li)+ ... + S pi-1 (n) exp(Li-1-Li)+ S pi+1(n) exp(Li+1-Li)+ ... + S pM(n) exp(LM-Li), where Li is a positive number that measures the leadership skills of an agent i. The quantity S measures the strength of the interactions between the agents, where 0 = S = 1/(M-1). For S = 1/(M-1) peer pressures in the network are very high. Hence S is a measure of peer pressures in the network. We use the logistic map to model diminishing returns: bin = ain (100% - pi(n)), where ai(n) is the appreciation of agent i at small participation levels. The quantity si. describes how much the personal situation of an individual affects the appreciation of the organization. We introduce a measure for the barriers to participation in the organization, si = ri s, where s > 0 is the spread of the barriers and ri is a random number between 0 and 1, i.e., 0 = ri = 1. s is a measure for the diversity of the group.
We use the following equation to model the dynamics of the appreciation: ai(n+1) = ? ai(n) + q pi(n) + f -si, where f is the net effect of incentives provided by the youth organization, teachers, parents, and other advocates. f describes those aspects of the appreciation that do not depend on participation in the organization, including advertisements. In contrast, the term q pi(n) describes the impact on the appreciation due to participating in the program. q is a measure of the quality of the program, compared to other youth programs. q = 1 means that the quality is high, and q = -1 means that the quality is low, whereas q = 0 means that the quality of the program is similar to other youth programs. The quantity ? describes the impact of past experiences, where 0 ? ? ? 1. ? = 1 means that memories have a strong impact on the current level of appreciation, whereas ? = 0 means that memories have no impact on the current level of appreciation. ai(n) is assumed to be within the parameter range of the logistic map, i.e., 0 = ai(n) = 4.
To model an average-quality youth program with no strong leaders we set q = 0 and Li=0 for all i. If the incentive f is small, only the agent with the smallest barrier develops a positive attitude and the participation and appreciation of the agents approach a stable fixed point, i.e., over time the participation of the agents approaches a constant value. In the following, m is the subscript of the agent with the minimum barrier, i.e., sm ? si. for i ? m. If the incentive is smaller than the smallest barrier, i.e., f<sm, the fixed point appreciation of all agents is zero, i.e., ai = 0 for all i. Consequently none of the agents participates, i.e., pi(?) = 0 for all i. However, if the incentive f is between the lowest barrier and the second-lowest barrier sm2, i.e., sm < f < sm2, then the fixed point appreciation of agent m is greater than zero, ai(?) = Bm/(1 - ?) for i = m otherwise, and ai(?)=0, where Bi = f - si is the benefit. The participation of the agents is still zero, i.e., pi(?)= 0 for all agents. Only if the benefit Bm exceeds a certain threshold Bc then a bifurcation occurs: the fixed point at zero becomes unstable and another fixed point becomes stable. The threshold incentive is Bc = (1-?)(1 + S - M S)(1 + S)/(1 + 2S - M S). This means that if Bc ? Bm ? Bm2 then the limiting participation of agent m is pi(?) = 100% if the peer pressure S is larger than Sc=1/(M-1) and pi(?) = 1 - (1 + S - M S)(1+S)/(am(1 + 2 S - M S)) for small peer pressure, i.e., S<Sc. And for the other agents, i ? m, the limiting participation of the agent is pi(?) = 100% as well, if the peer pressure S is larger than Sc and pi(?) =1 - pm(?)S/(1 + 2 S - M S) for small peer pressure, i.e., S < Sc. Hence if the peer pressure is greater than the threshold Sc then the limiting participation of all agents jumps from zero to 100% when the benefits exceed the critical value Bc. If the peer pressure is greater than the threshold Sc then the limiting participation of all agents increases gradually to 100% as soon as the benefits exceed Bc appreciation. Despite the fact that the appreciation of the other agents is zero, they start to participate due to the peer pressure from agent 6. The limiting values of the simulation for the participation and the appreciation of the agents are in excellent agreement with the theoretical values (see Figure 1). Figure 2 shows the time dependence of a system with 10 agents with random barriers, s1=0.76, s2=0.92, s3=0.89, s4=0.41, s5=0.35, s6=0.11, s7=0.64, s8=0.36, s9=0.49, s10=0.73, the incentive f=0.3, and memory ?=0.8. The peer pressure is high but below Sc, i.e., S = 0.1 < Sc. For this set of barriers, agent 6 has the lowest barrier, i.e., m=6. For this parameter set agent 6 is the only agent who has a positive benefit, i.e., Bm > 0, whereas Bi < 0 if i ? m. Figure 2 shows that agent 6 is the only agent who develops a positive appreciation.
To model a system where the agent with the smallest barrier is a strong leader as well, we set Lm=1 and Li=0 for i ? m, and an average-quality youth program, i.e., q=0. The dynamics of the participation is pi(n+1) = ai(n)pi(n) (1 - pi(n)) + Pi(n), and the dynamics of the appreciation is ai(n+1) = ? ai(n) + Bi. We find that the limiting value of the appreciation is ai(8)=Bi/(1- ?) if Bi > 0 and ai(?)=0 otherwise. If the incentive is smaller than the smallest barrier sm, i.e., f < sm, then the benefit is negative for all agents, i.e., Bi = 0 for all i, and the fixed point appreciation of all agents is zero too, i.e., ai(?)=0 for all agents. However, if the incentive f is between the lowest barrier and the second lowest barrier sm2 , i.e., sm < f < Sm2, then agent m has a positive benefit Bm > 0 and the fixed point appreciation of agent m is greater than zero, whereas the appreciation level of the other agents is still zero. In the following we will consider this case. Since agent m is the only agent with non-zero appreciation, we treat agent m separately from the other agents. Since the other agents have the same equation, we make the assumption that their fixed point values are the same and equal to the fixed point values of the agent with the second-smallest barrier m2. With the constraint 0 ? pi(?) ? 1 we find pm(?) = 0, if 0 ? Bm ? Bc ; pm(?) = 1 - (1 + S - M S)(1+S)/(am(?) (1 + 2 S - M S)), if Bc ? Bm ? Bd and S ? Sc; Pm(?) = (am(?))-1+((am(?))-1)2+4 am(?) S (M-1) e-Lm)1/2)/(2 am(?)) if S < Sc; and pm(?) = 1 otherwise. The condition pm2(?) = pm(?) (S eLm/(1 + 2 S - M S) ? 1 is true if Bm ? Bd, where Bd = (eLm(1-?)S(1+S)(1-(M-1)S))/((1-(M-2)S)(1-(M- 2+eLm)S)). The condition pm(?) ? 0 means 1 - ((1 + S - M S)(1+S))/(am(?) (1 + 2 S - M S)) ? 0. This is true if Bm ? Bc wherem Bc = (1-?)(1 + S - M S)(1 + S)/(1 + 2S - M S). The condition pm(?) ? 1 means 1 - ((1 + S - MS)(1+S))/(am(?)(1 + 2 S-MS)) ? 1. This is true if S ? Sc where Sc = 1/(M-1). With these equations we obtain for the participation of all agents, except for agent m: pi(?) = 0, if 0 ? Bm ? Bc; pi(?) = (S eLm)/(1 + 2 S - M S)(1 - ((1 + S - M S)(1+S))/(am(?) (1 + 2 S - M S))), if Bc ? Bm ? Bd and S ? Sc ; pi(?) = 1 otherwise. The dashed lines in Figure 3 are determined with this formula.
To model the situation where the incentives are changing slowly, we set f = f0) + n?f. We determine the average level of participation p(n) = (p1(n) + p2(n) + ... + pM(n))/M.
Figure 4 shows a numerical simulation of a social system for f0) = 0$ and ?f=0.0007. All other parameters are as in Figure 2. The parameters are S=0.1, M=10, and s=1.