Introduction
The spatial evolution of cities has been the subject of many studies for over a century. Previous work attempted to find explanations for the way cities evolve and arrange themselves in space, based on data collected at the municipal level (Jefferson, 1939; Zipf, 1941; Anas et al., 1998). In reality, however, the spatial evolution of cities extends beyond municipal boundaries. The nature of the data used in past studies created distortions in the description of urban phenomena and in tests of hypotheses. Furthermore, the models used to study urban dynamics, whether they originated in fields of cultural studies, politics, sociology, or economics, utilized unrealistic mathematical functions (Christaller, 1933; Alonso, 1964). Thus, no existing model provides a complete and precise explanation of the physical similarity found among urban structures (Batty & Longley, 1994).
Recent research has illustrated that it is useful to think of cities as self-organizing (Batty and Longley, 1994; Portugali, 2000). The presented work relies on this conception of cities and the fact that urban morphology is amenable to mathematical description and analysis. It utilizes concepts and tools from theories of complexity, self-organization, chaos, and fractal geometry. Previous work has shown that urban areas can be characterized as fractals (Batty & Longley, 1987, 1994; Batty et al., 1989; Frankhauser, 1990, 1994; Batty & Xie, 1996; Shen, 1997, 2002; White & Engelen, 1993; White et al., 2001). Makse et al. (1995) proposed a percolation model that relates the morphology of built areas to the location decisions of its population. Benguigui et al. (2001a) developed a cellular automaton model that simulated the development of the footprint of the built areas in one city within the Tel-Aviv metropolis.
Patterns of urban morphology exhibit similarity to phenomena known in physics as cluster formation. This led to the hypothesis that there may be a general explanation of the arrangement of these structures in space (Schweitzer, 1997). In a previous work we presented an approach to understanding the spatial distribution and structure of cities based on morphology alone (Benguigui et al., 2006). The novelty in this approach is the replacement of municipalities as units of examination by urban clusters, defined as contiguous built areas. This enabled us to ignore changes of the cities’ boundaries that are related to political decisions rather than to real changes in the city spatial distribution.
In this study we focus on the largest cluster in the Tel-Aviv metropolis and show how changes in its morphology might be used to identify socio-economic changes. This is as the largest cluster is compounded of the core city of the metropolis (i.e., Tel Aviv) and its surrounding municipalities. This agglomeration of cities works as the financial, political, and cultural center of the metropolis and in many terms of the entire country.
The next section provides a methodological discussion at the backdrop of the research. Section 3 focuses on the analysis of the morphology of the largest cluster. The discussion in Section 4 relates the mathematical results with socio-economic phenomena in the history of the Tel-Aviv metropolis. Based on this analysis several conclusions and recommendations are presented in the final section.
Methodology
We identified urban clusters in the Tel-Aviv metropolis based on a series of maps of the Tel-Aviv region representing the years 1935 and 2000. The boundaries of the area analyzed remained fixed throughout the study period. Thus, the boundaries were determined independently of the boundary of the metropolitan area. The latter changed with time. The area studied is bounded by the city of Natanya in the north and by the city of Yavne in the south. These outer borders of the Tel-Aviv metropolis are widely accepted and include the metropolis in all the periods included in the study.
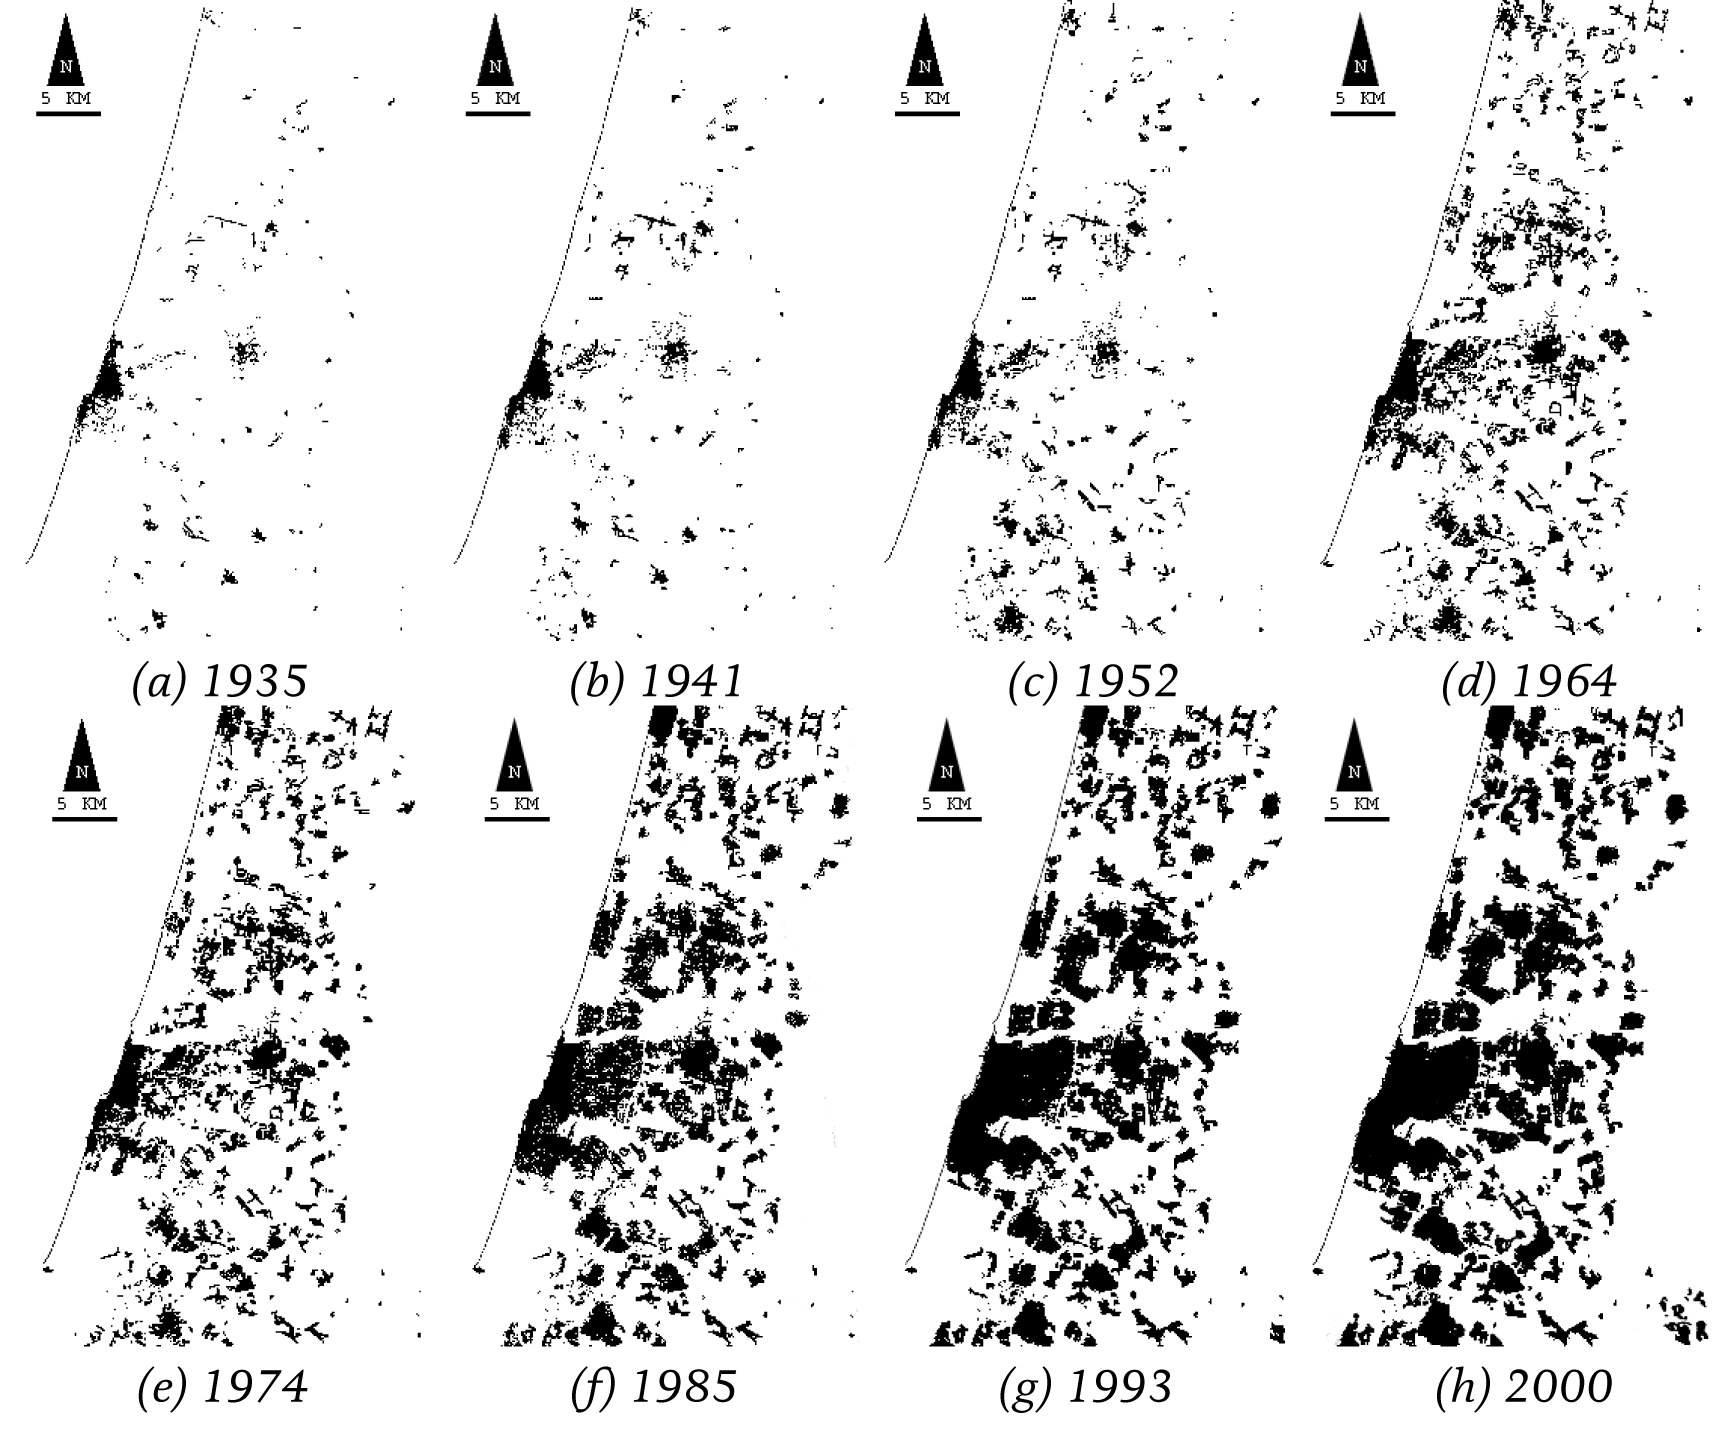
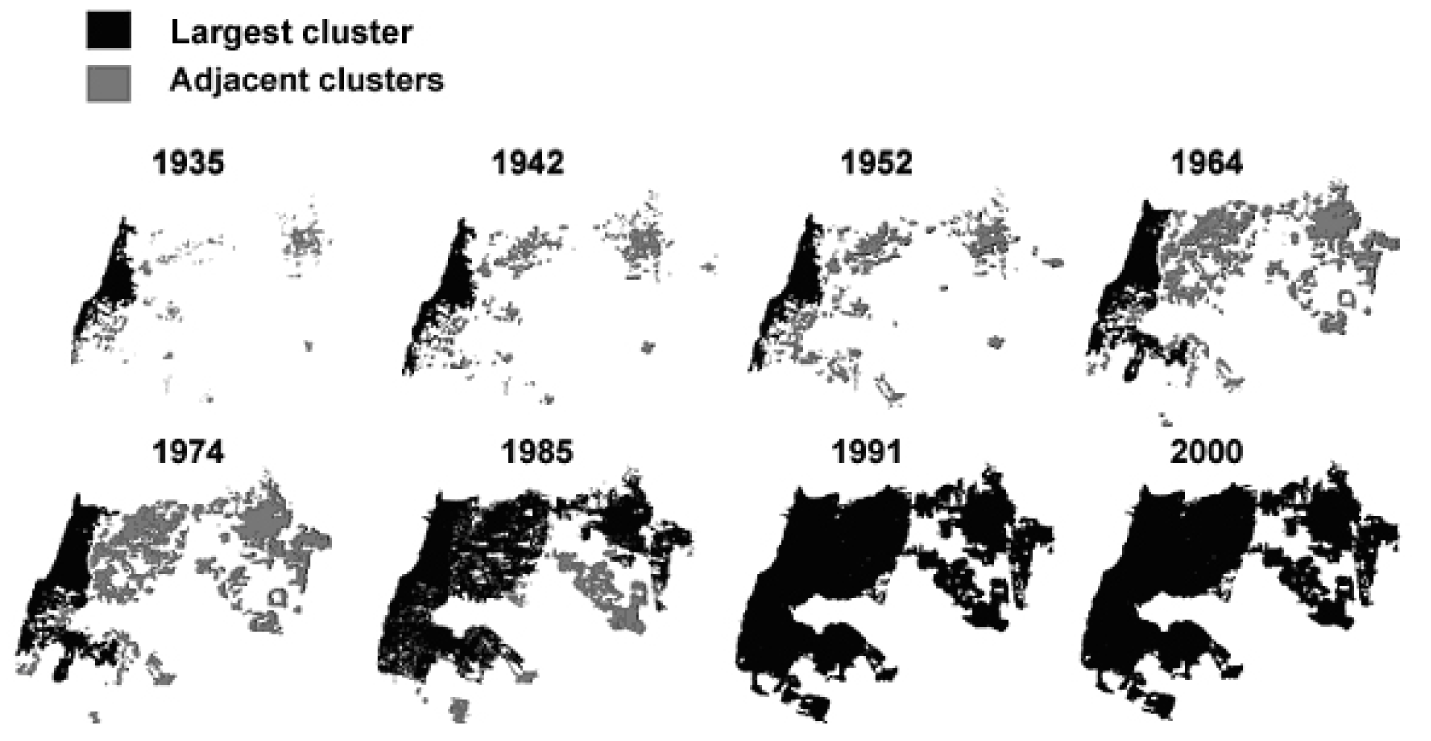
We digitized the historic maps and copied the built areas into new maps, suppressing non-built areas such as roads and railroads. The new maps are presented in Figures 1a to 1h. We used a black and white reduction of the maps. A black pixel represents an occupied site (a built area) while a white pixel an empty one. We defined a cluster by contiguity properties of the black pixels. The contiguity was determined as the sequence created by the touch of each pixel with its eight closest neighbors on a square lattice. Small clusters that had no urban characteristics (e.g., military facilities) were defined as noise. Such clusters were deleted. Each of the deleted clusters was smaller than 45,000 m2.
In order to conduct a precise analysis of the clusters, we calculated the values of the area and the perimeter of each using the MATLAB computer software. The basic unit of the measurement was 1 pixel which represents a length of 30 meters.
Several different analyses of the data for each of the clusters were carried out at two levels: the first for the entire Tel-Aviv metropolis and the second examined the largest cluster alone. In Benguigui et al. (2006) we focused on the morphology of the entire metropolis and Table 1 presents the summary of these results.
One can distinguish three stages in the city’s evolution, based on the changes presented in Table 1. The first stage occurred between the 1930s and the 1960s. The second was between the 1960s and the 1980s. And the third took place in the years between the 1980s and the 2000s. The changes observed in the 1980s were found in all the examined parameters. Thus, we assumed the processes that led to these changes were more varied and powerful. As a result when we tried to associate the socio-economic trends and processes we have decided to focus on these years.
The next section presents the analysis of the data for the largest cluster comprised of the city of Tel-Aviv and its adjacent towns.
The Largest Cluster in the Metropolitan Context
Cluster size
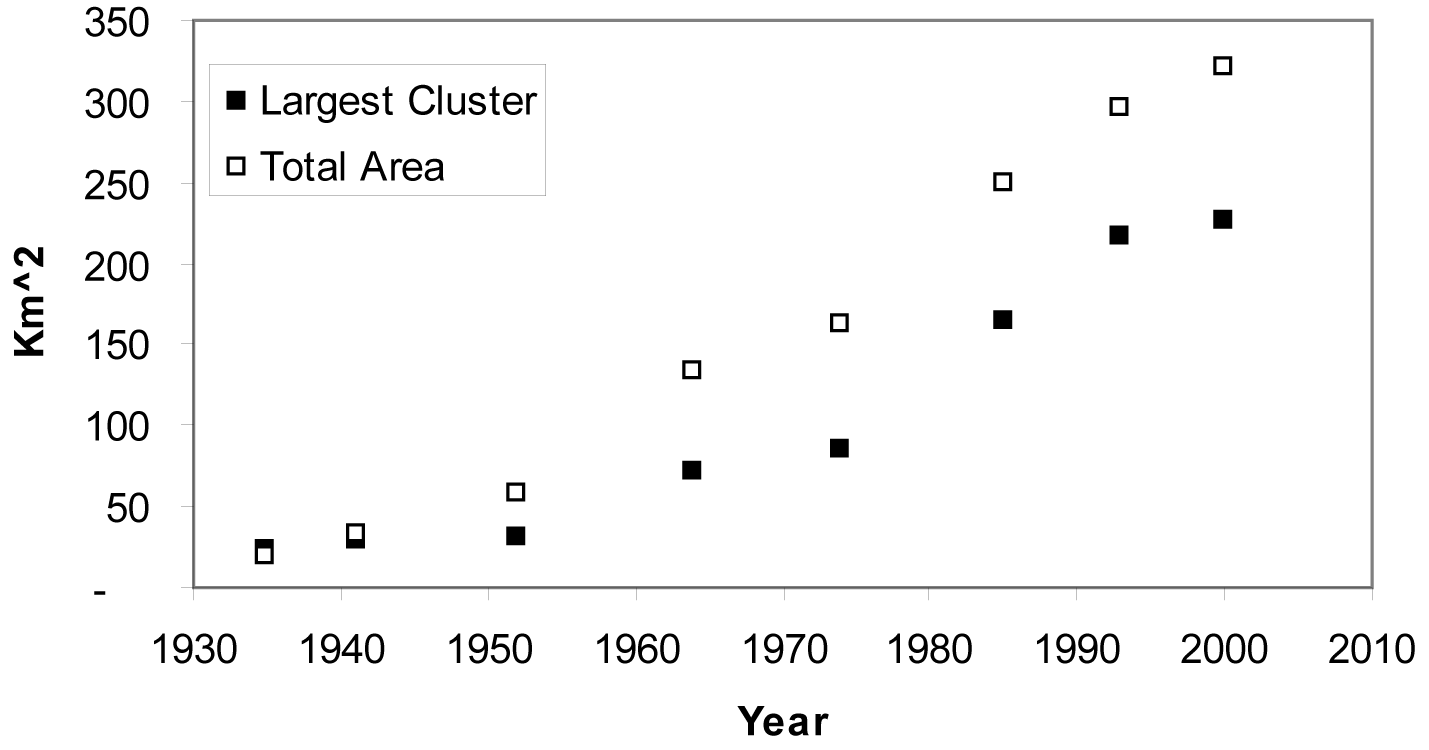
The area of the cluster was used as its main indicative characteristic. Figure 2a presents the growth of the area A(t) of the largest cluster and of all the clusters in the
Table?1
Summary of the Analysis of Clusters in the Tel-Aviv Metropolis
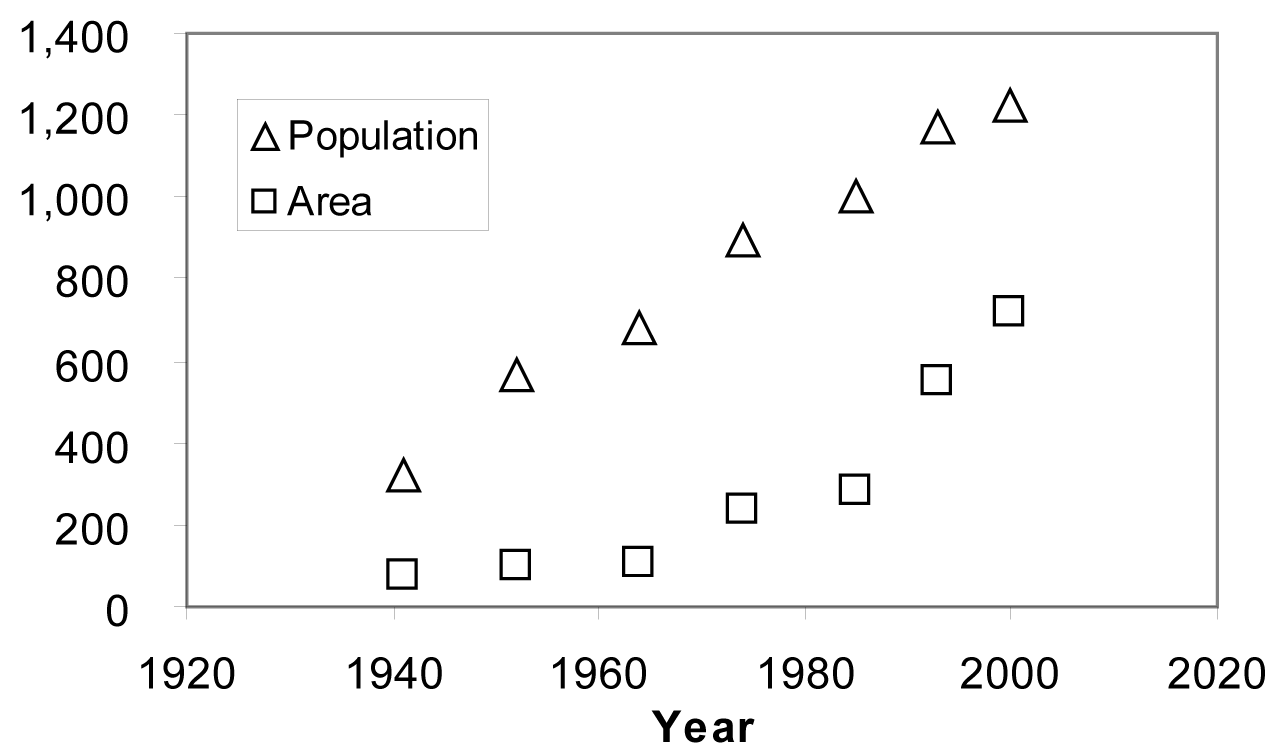
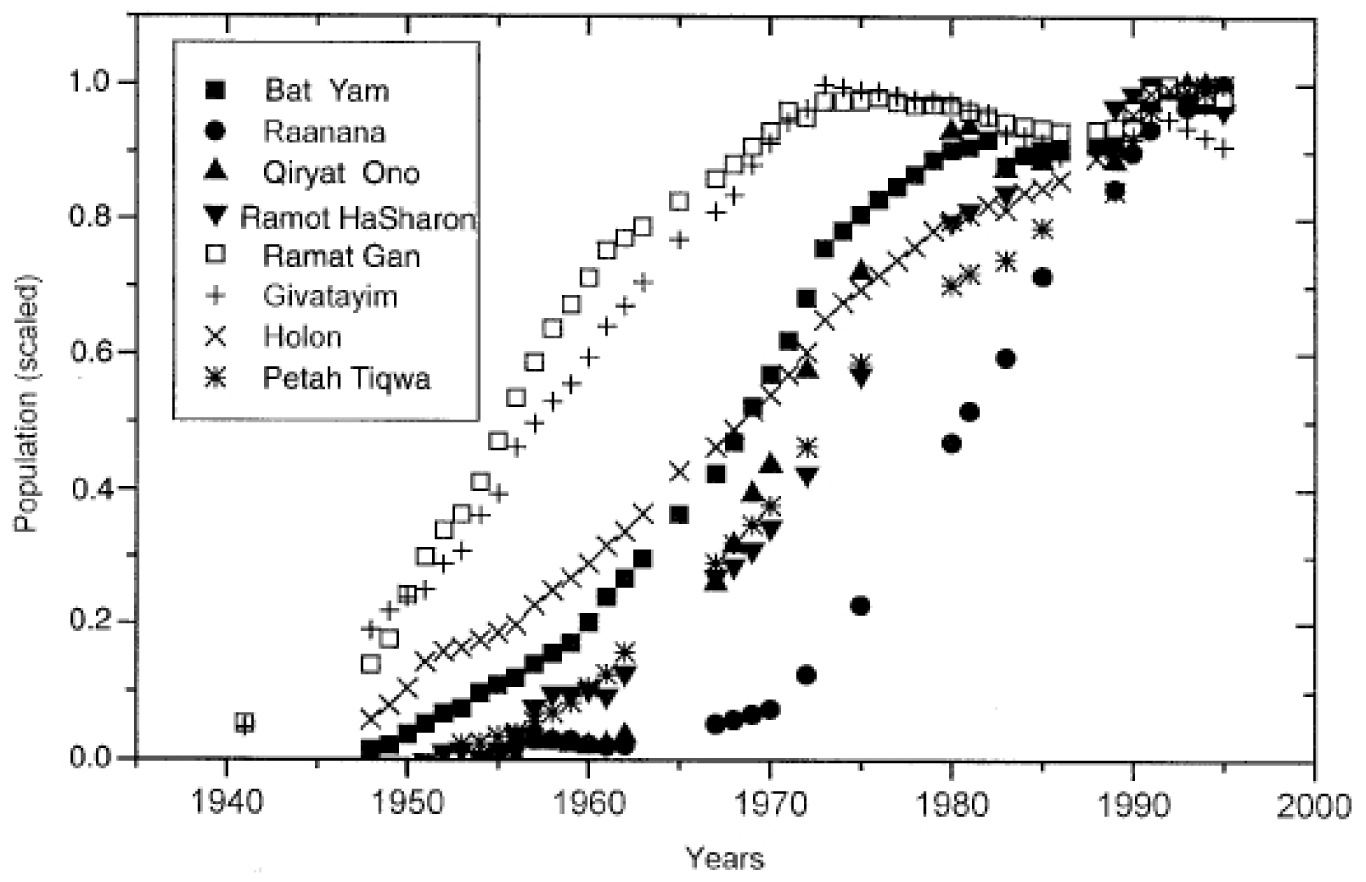
A comparison between the growth of area of the largest cluster and the growth of the population of the Tel-Aviv and its surrounding municipalities did not explain the anomalies in the curve A(t) (see Figure 3a). The total population of the municipalities that create the largest cluster experienced linear growth from the 1950s onward. The population of the individual cities, however, Bat Yam, Qiryat Ono, Holon, and Petah Tiqwa, that are adjacent to the city of Tel-Aviv, developed rapidly between the 1960s and the 1980s (see Figure 4). These cities became part of the largest cluster in 1985. Thus the intensive development they experienced previous to the 1980s influenced the area of the largest cluster from that time onward.
From 1935 to 1974 the largest cluster was surrounded by many small clusters (see Figure 5). In 1985 the largest cluster merged with 11 of its neighboring clusters and thus its area increased significantly. These clusters were compounded of the municipalities, adjacent to the core city—Tel Aviv. This agglomeration occurred due to the continuous growth of each cluster, i.e., each cluster developed towards its neighboring clusters until they merged together.
Consequently, the largest cluster, which was compounded of the city of Tel Aviv only until the 1970s, included additional municipalities from the 1980s onward.
Area and perimeter
As seen in the Figure 1, the urban clusters in the Tel-Aviv metropolis have irregular shapes. We used the box-counting method on a random
Figure?2a
The Growth of the Total Area and of the Largest Cluster Area between the Years 1935-2000 (the values are normalized).
Figure?3
The Growth of Area and population of the largest cluster and its municipalities between the Years 1935-2000 (the values of the area are normalizes).
We used the fractal characterization of the clusters to calculate the value of ? which indicates the shape, or the morphology, of the clusters:
(1) Perimeter ? Area?,
(where ?=DL/DA).
Where DL represents the fractal dimension of the perimeter and DA represents the fractal dimension of the area of the clusters. The values of ? are bounded between 0.5 and 1 (as it is reasonable to assume that DA>DL). Values that are close to 0.5 indicate a quasi-circular cluster while values close to 1 indicate a highly irregular shape.
The values of ? for the largest cluster were constant from 1935 to 1985 and equal to approximately 1 (see Figure 6). This value is higher than the average value of ? for the rest of the clusters that was 0.75. The value 1 represents an irregular morphology and indeed, the largest cluster had a very complicated shape during these years (see Figure 5). From 1985 onwards the values of ? did not align with the rest of the data. There was not enough data for these years to perform a new regression, thus we cannot determine conclusively the values of ? from 1985 onwards. We can assume, however, with high probability that the relationship between the area and perimeter of the largest cluster is always valid but with ? smaller than 1.
The Rank Size Distribution
From Auerbach (1913) and onwards, it has been widely accepted that the Pareto distribution represents the city size distribution accurately (i.e., the relationship between the ranks of cities and their sizes). The Pareto distribution is also known as the “rank size rule”. “Zipf’s law” (Zipf, 1941) is the case in which the Pareto exponent is unity which means the largest city is twice the size of the second largest city, and N times the size of the city with rank N.
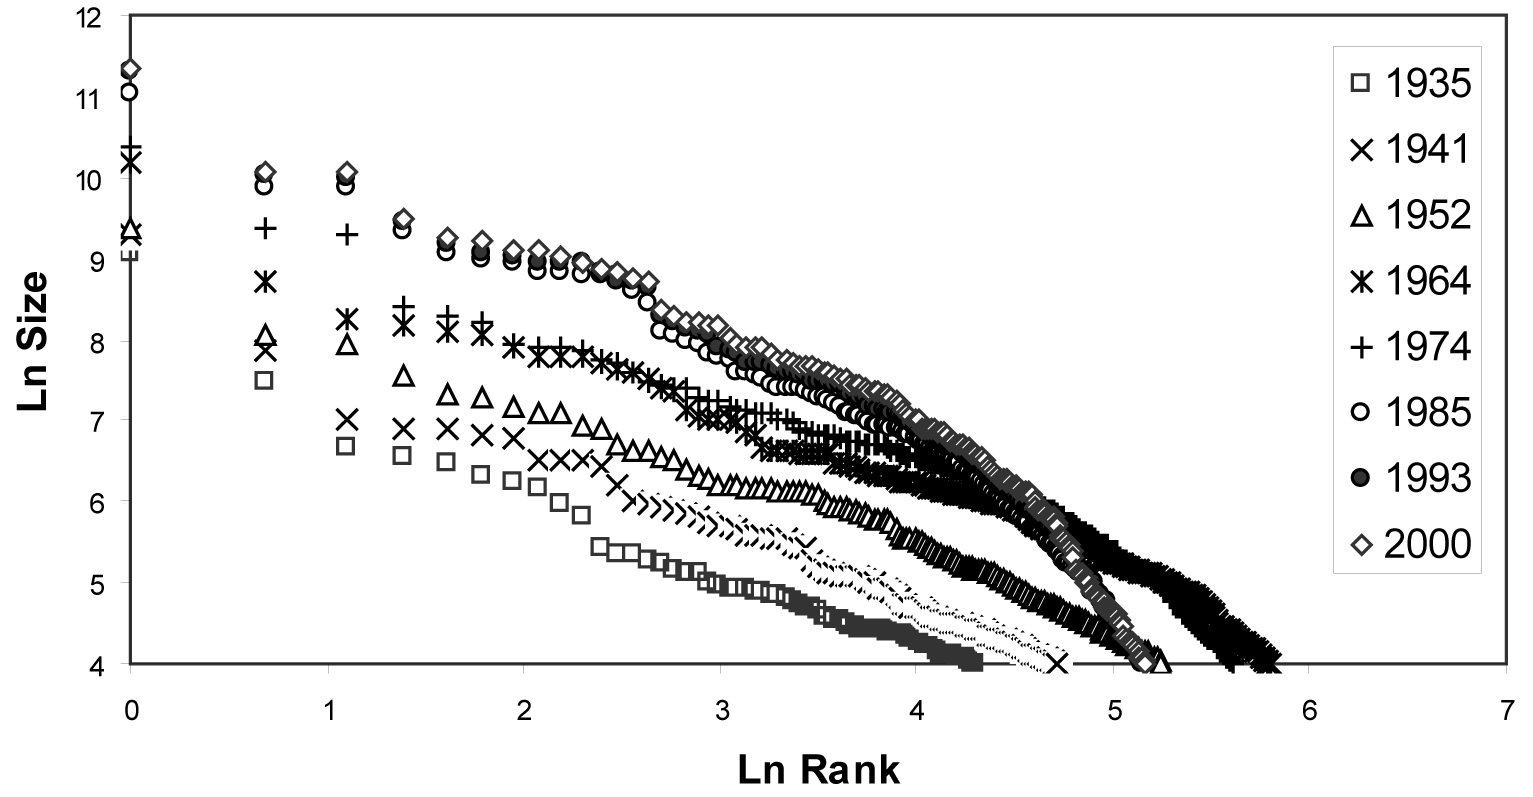
Schweitzer (1997) was the first to examine the Pareto relationship between urban areas based on their morphology instead of their population. In Benguigui et al. (2006) we followed Schweitzer in calculating the rank size distribution of urban clusters in the Tel-Aviv metropolitan area in different years (Figure 7).
Figure 7 shows that the largest cluster did not align with the rest of the clusters in the entire period studied (the circled dots represent the largest cluster). This resembles the phenomenon of a primate city, i.e., the largest cluster was and is more than twice as big as the next cluster in size. In other words, the largest cluster was the most influential cluster throughout the entire period studied (see further discussion in the next section).
Discussion
The cluster approach to the study of urban dynamics revealed a number of major changes in the history of the morphology of the largest cluster in the Tel-Aviv metropolis.
The major changes in the morphology occurred twice during the city’s history—in the 1960s and in the 1980s. The changes in these years were revealed both in the morphology of the largest cluster and in the morphology of the entire metropolis. As a result, there were three distinct stages in the city’s history. The first stage occurred between the 1930s and the 1960s. The second stage was between the 1960s and the 1980s. And the third stage took place in the years between the 1980s and the 2000s. The changes observed in the 1980s were more explicit than those of the 1960s and are revealed in all of the parameters examined. We therefore assumed that the processes that led to these changes were more varied and powerful. By examining several socio-economic phenomena that affected the development of the largest cluster, we suggest some explanations for these findings.
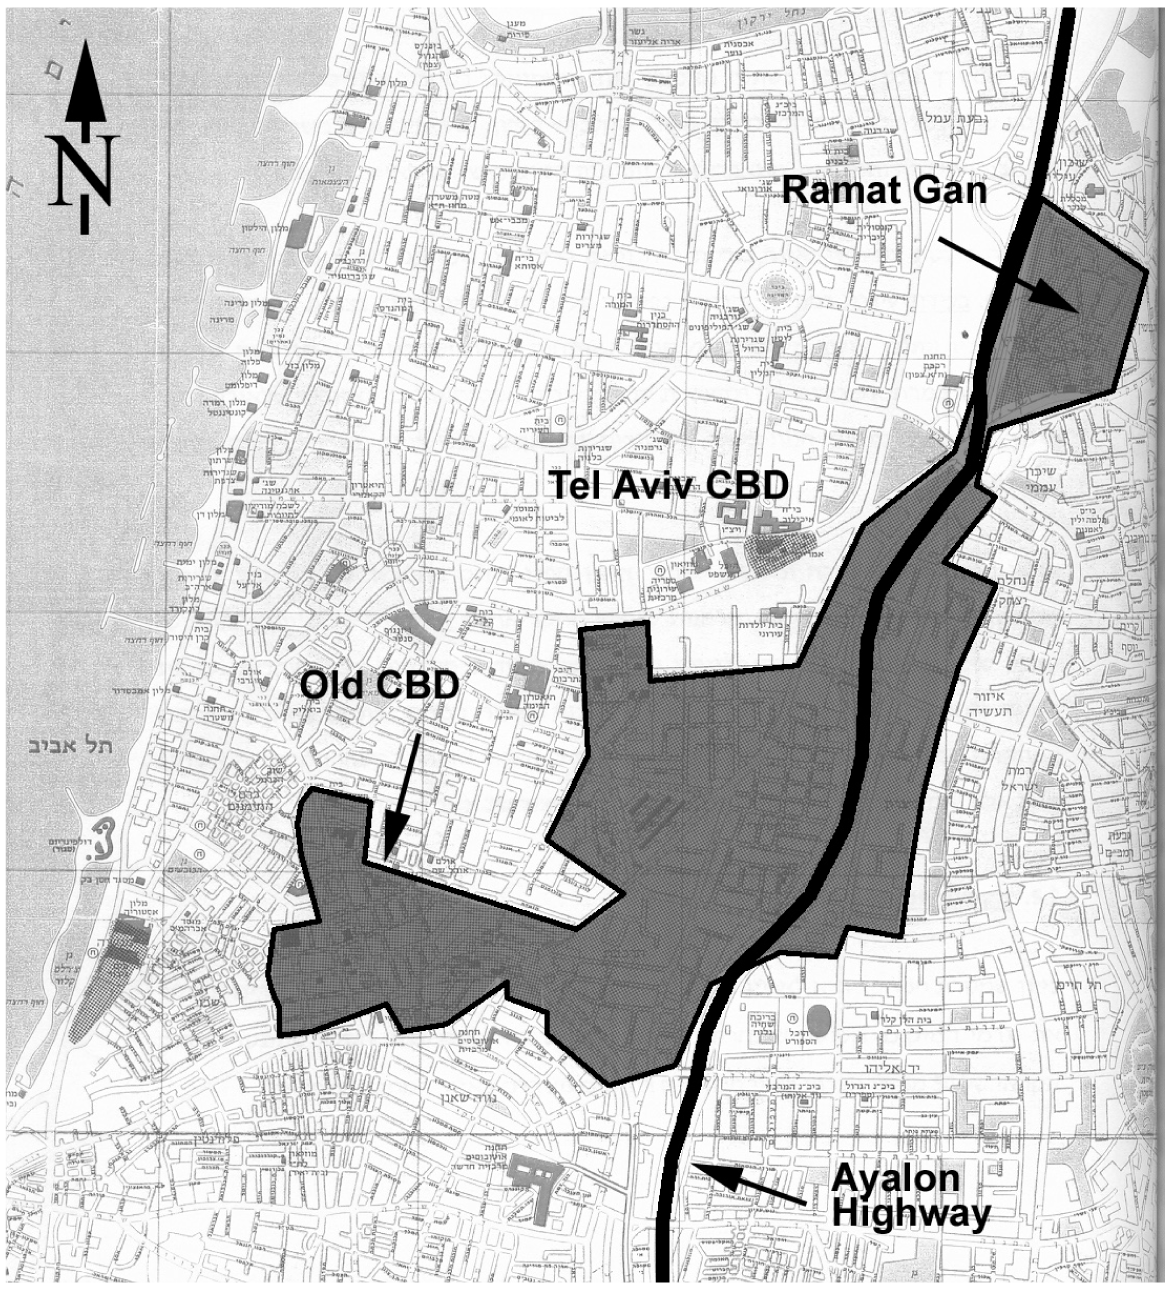
The significant increase in the area of the largest cluster that occurred in the 1980s can be explained by two main factors. The first is the inclusion of residential areas, as well as business and industrial area, in the largest cluster. The latter were affected by the construction of the main highway in the metropolis, the Ayalon Highway (see Figure 8, the Ayalon highway is represented by the gray line). The Ayalon Highway, located on the banks of the Ayalon stream, improved the accessibility at regional and national scales, causing many post-industrial firms to move to this area and creating an increased demand for office space on the banks of the Ayalon Highway. This demand was further compounded with the adoption of an urban plan named the Mazor plan by the municipality of Tel-Aviv. One of the guidelines of the Mazor plan was the relocation of non-residential usages that were in residential buildings. Thus, many firms had to find a new base for their offices. Although the major impact of the Mazor plan was in the late 1980s, its influence on the city began early in that decade.
As a result of these changes, the CBD (Central Business District) of Tel-Aviv grew to span the entire area from the traditional CBD to the opposite side of the Ayalon Highway (see Figure 9). The massive building on the
banks of the Ayalon changed the morphology of the built environment as it united both sides of the Ayalon into a unique cluster. Thus, the largest cluster, which in 1975 was composed of the cities Tel-Aviv, Bat Yam, Holon, and part of Rishon LeZion agglomerated with additional municipalities that formed clusters on the eastern bank of the Ayalon (Figure 8). The result was a significantly large cluster containing more than 25% of the total built area of the metropolis. In 1974, in comparison, the largest cluster occupied only 12.2% of the total built area of the metropolis.
The second factor that influenced the morphology of the largest cluster was the increase in the population of cities adjacent to Tel-Aviv (Figure 4). The development of each of the individual cities within the metropolis took place in four stages (Benguigui et al., 2001). This form of development is known as “leap frogging”. In stage 1 there is a constant increase in the population in each cluster. In the second the rate of population increase reaches its maximum. Stage 3 defines population saturation and in stage 4 the population of the city oscillates.
Most of the cities in the Tel-Aviv metropolis, (presented in Figure 4,) reached the third stage by the 1980s, i.e., they had reached population saturation by that time. The cities, Bat Yam, Qiryat Ono, Holon, and Petah Tiqwa, went through the second stage (significant increase in population) between the 1960s and the 1980s. Thus, prior to the mid 1980s, all these cities faced an intensive development which influenced their built area.
There are economic underpinnings to this rapid and significant development. In the years following the Six-Day War (1967), Israel’s real per capita GDP increased substantially. This can be seen in the steep slope after 1967 in Figure 10. In addition, a political upheaval in 1977 led to the formation of the first right-winged liberal government in Israel’s history. The new government established a new economic policy which was based on the principles of a capitalistic market. The resulting economic prosperity, along with the liberalization of the market, led to an improvement in the standard of living and in the standard of residences (Carmon & Czamanski, 1992). As a result, the demand for one-floor housing in the central district and in the Tel-Aviv district increased significantly. The demand surplus
created an atmosphere of lack of land and increased the political pressures to change land usage from agricultural to residential. These pressures were fruitful and in the late 1970s Israel Land Administrator increased the number of tenders in one-floor housing neighborhoods by 130%. The city’s population migrated to new and more spacious settlements beyond the geographical core of the metropolis (Benguigui et al., 2000). This extension of urban activities to suburbs in the rural area as well as to dormitory towns, adjacent to the city of Tel-Aviv, led to the creation of new urban centers and to a significant change in the Tel-Aviv morphology and in the largest cluster area.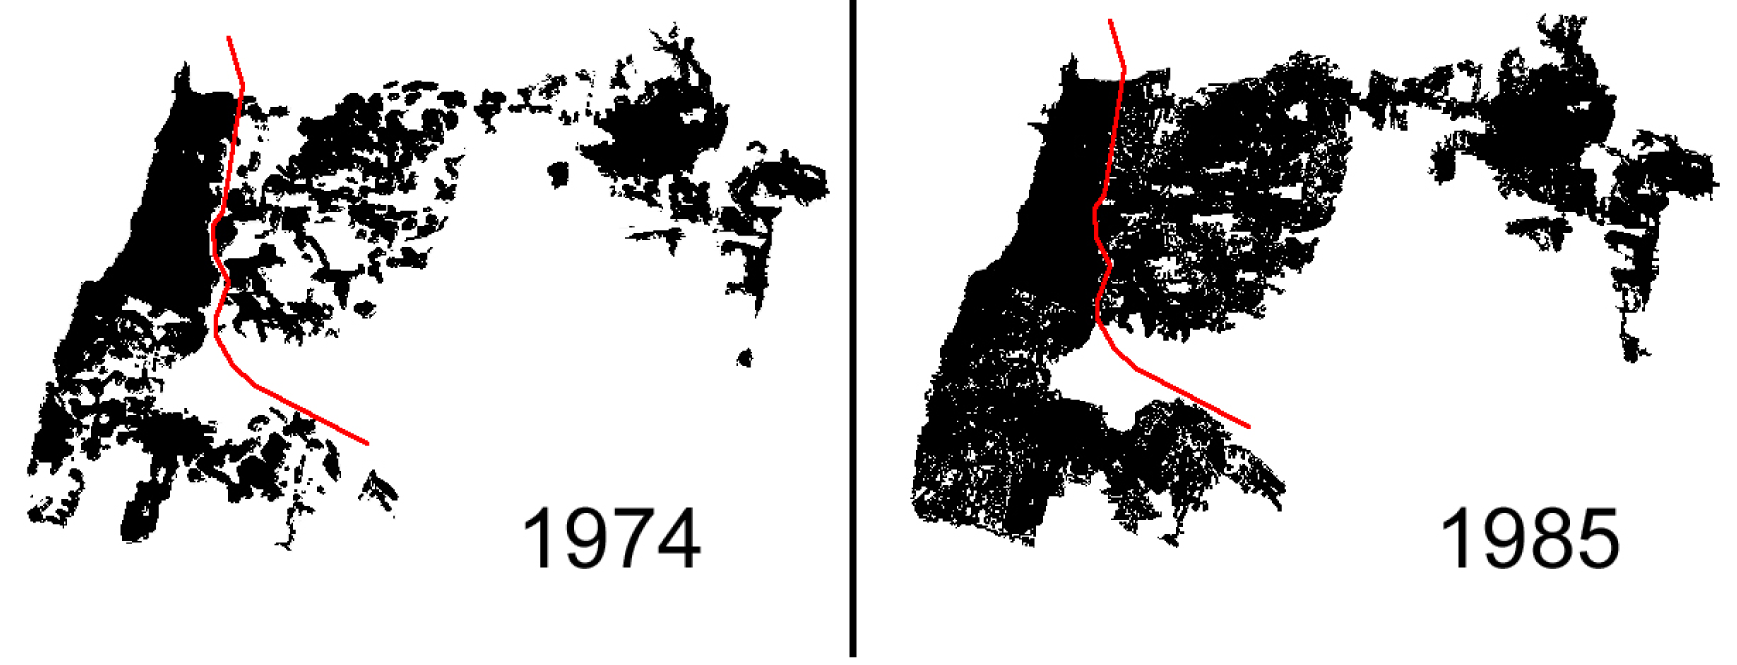
The development of the cities near Tel-Aviv can be divided into two processes. At first there was enough space to allow leap frogging, but when each of the cities came close to saturation, the only way the cities could continue to grow was by filling vacant locations within their boundaries. Clusters within each of these municipalities agglomerated with their neighboring clusters and created new continuous clusters. As the boundaries of these municipalities often overlapped, clusters located at the boundaries of the municipalities agglomerated with clusters of adjacent municipalities. Thus, in 1985 most of the clusters, adjacent to the largest cluster, agglomerated with it and the intensive development of these cities affected the area of the largest cluster in that year. From 1990s onward the population of these cities hardly changed as did the area of the largest cluster.
The leap frogging process influenced the development of the municipalities adjacent to Tel-Aviv until 1974. Each of these municipalities developed at a different rate, but by the 1980s most of them had reached saturation. Thus, from 1985 onwards the continuous growth process dominated the development of the clusters within these municipalities. In other words, from 1985 onwards the creation of new clusters within the area of the largest cluster stopped. From 1993 onwards the agglomeration of the largest cluster with its neighboring clusters ceased as well. These findings are not with agreement with Schweitzer’s (1997) conclusion about the development of the largest cluster, which is based on his analysis of the development of urban clusters in Berlin. He claimed that the largest cluster did not grow proportionally to its size, but only through agglomeration with its neighboring clusters. In the case of the Tel-Aviv metropolis the largest cluster stopped growing as a result of agglomeration with its neighboring clusters, and from 1993 onwards it grew only as a result of self-filling, i.e., filling the empty location within the cluster’s area.
These changes in the dominate growth process can also explain the change in the values of ? for the largest cluster. There are three processes that yield a decrease in the value of ?: First, the fractal dimension of the perimeter (DL) decreases. Second, the fractal dimension of the area (DA) increases. And third, both the first and the second processes occur at the same time. In the Tel-Aviv metropolis the largest cluster became more compact and less irregular with time mainly due to a self-filling process. This process affected the fractal dimension of both the area and the perimeter of the largest cluster. The self-filling of locations within the cluster’s area caused the increase in its DA, while the self-filling of locations on the cluster’s perimeter caused the decrease of its DL. Thus, there was a decrease in the value of ? (which equaled 1 until 1985).
The rank size distribution of the clusters in the Tel-Aviv metropolis shows a resemblance of the largest cluster to a primate city. This can be explained both by socio-economic activities and by the size of the population. As opposed to the population of its neighboring clusters the population of the city of Tel-Aviv decreased constantly from the 1960s until the mid 1980s. Until the mid 1970s, the largest cluster was composed of the built area within the city of Tel-Aviv alone, but nevertheless, it was the dominant cluster and resembled a primate city. This phenomenon can be explained by socio economic activities within the city of Tel-Aviv. Tel-Aviv was declared an independent municipality in 1921. From its early days it was both the core of and the dominant city in the metropolis in terms of business and culture activities. During the 1930s and the 1940s Tel-Aviv matured to be a central city in terms of employment and services. After Israel’s declaration of independence in 1948 the economic growth which characterized the country at the time had a positive influence on the economic activitiy in Tel-Aviv and the city became a national center of banking and finance. In 1950 Jaffa was formally appended to Tel Aviv and most of the immigrants who came to Tel Aviv after 1948 were dwelled in the deserted houses of Jaffa and the Arab villages near Tel Aviv. During the 1960s and 1970s, Tel-Aviv became an employment base for a growing number of commuters from the entire metropolis. In addition, the city developed as the major cultural center of Israel, and expanded its cultural activities and facilities. As mentioned earlier, clusters were defined as a contiguity of built-up area, without distinguishing between different land usages. Thus, the fact that the population of the city of Tel Aviv decreased did not affect the growth of the largest cluster. It was due to the development of the city as a business and cultural center rather than the development of new neighborhoods which influenced its development in the early years. Primate cities dominate the country in terms of influence, and are the national focal-point. Thus, it is not surprising that the largest cluster, which until the 1980s was composed mainly of the city of Tel-Aviv, had the characteristics of a primate city.
From the 1980s onward the largest cluster agglomerated with other clusters and contained the cities of Tel-Aviv-Jaffa, Ramat-Gan,
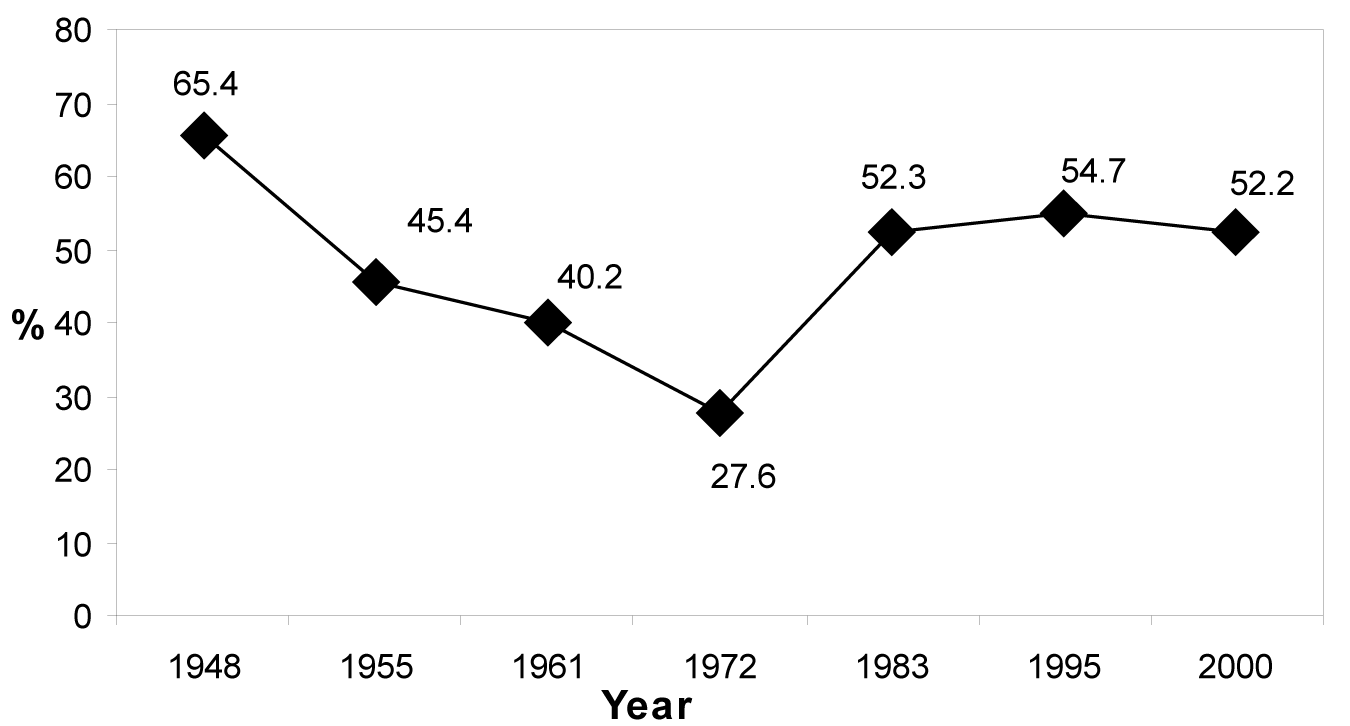
Givataim, Bney-Brak, Holon, Rishon LeZion, Petah Tiqwa, Qiryat Ono, and Bat-Yam. As a result, the population of the largest cluster as a percentage of the population of the metropolis increased from 27.6% in 1972 to 52.3% in 1983 (see Figure 11). The characteristic of the largest cluster as a primate city strengthened with the increase in the centrality of Tel-Aviv and its surrounding cities in terms of business facilities and cultural activities.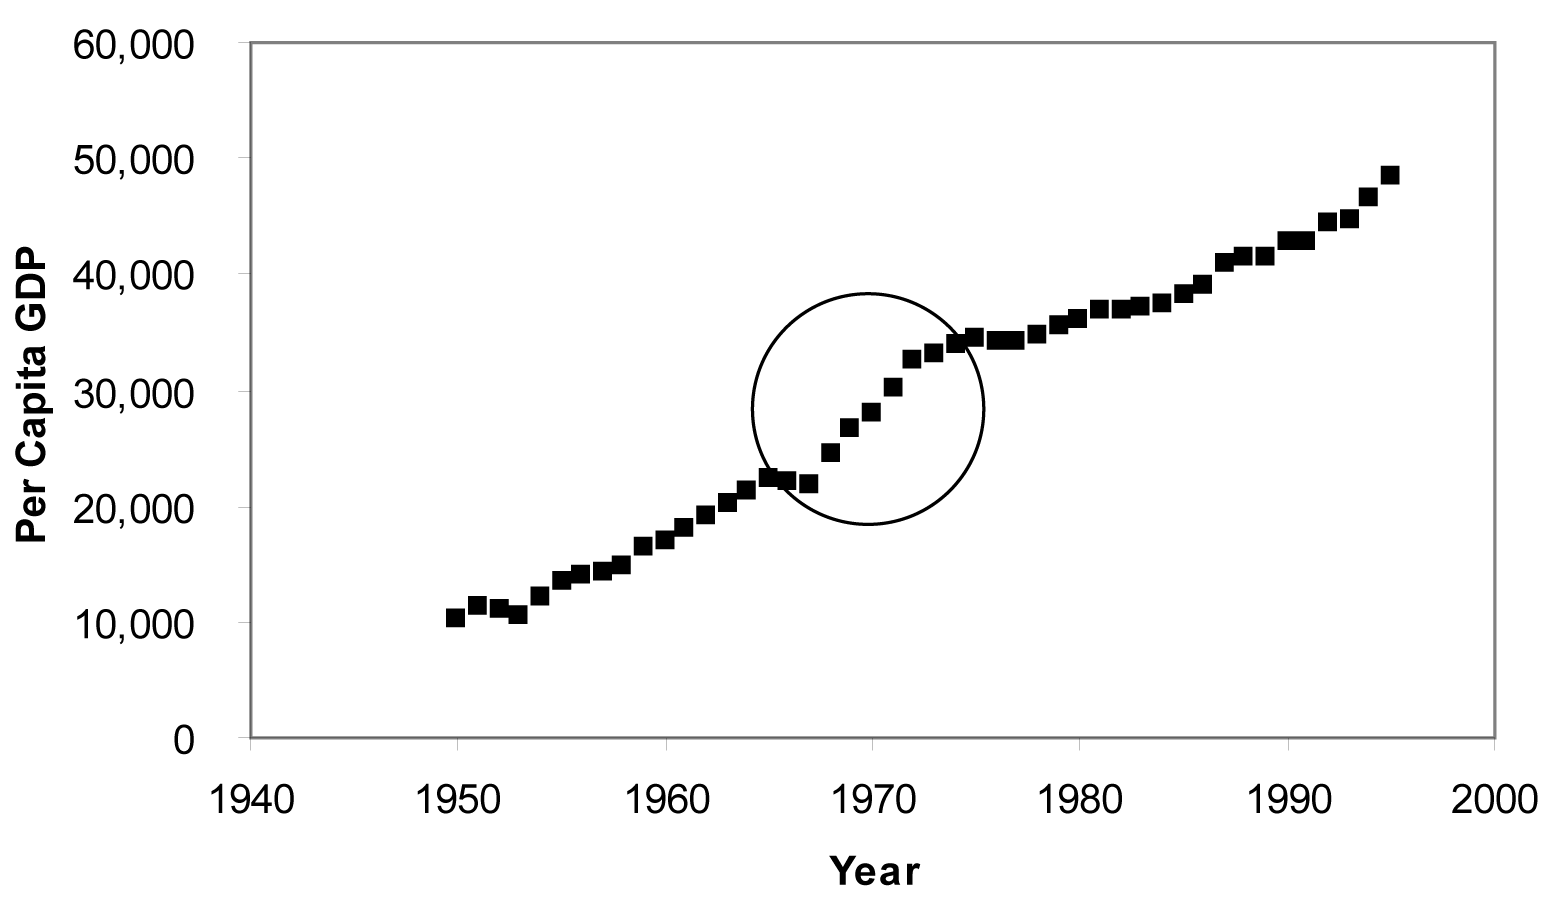
To summarize, the largest cluster characteristic as a primate city was influenced by both the fact that Tel-Aviv has always been a national business and cultural center, and the fact that from 1985 onwards, the population of the largest cluster included more than 50% of the metropolis population.
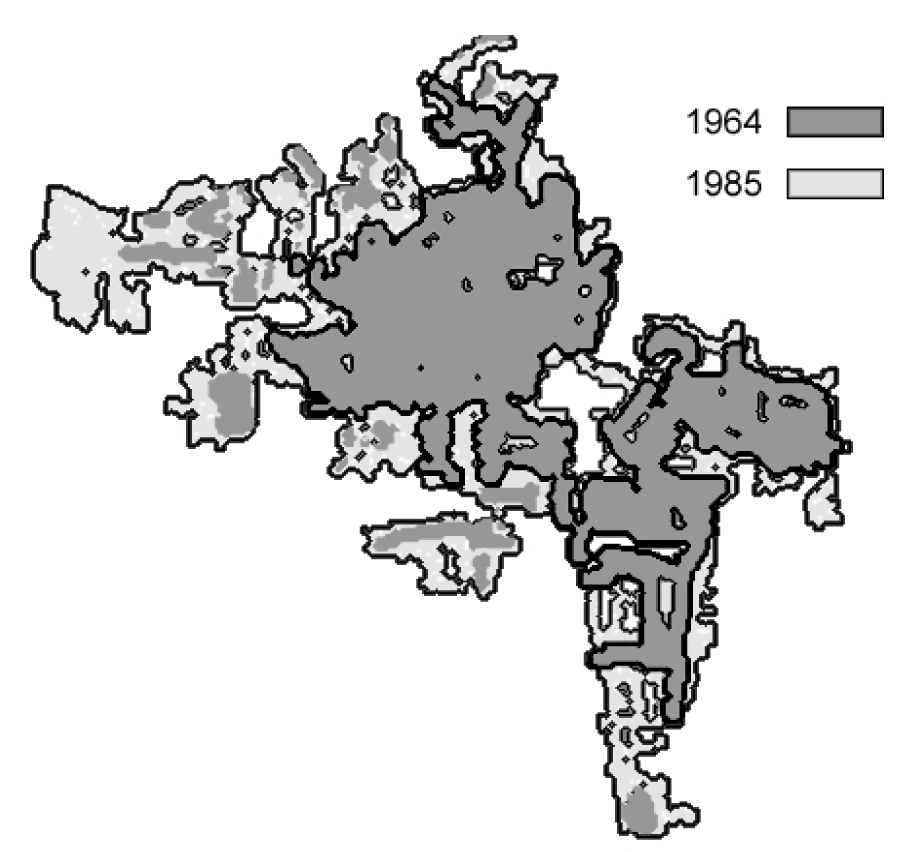
An additional reason for the growth of the largest cluster lies in the new settlement policy established by the new government, elected in 1977. This policy legitimized Jewish settlements in the west areas of Judah and Samaria (The West Bank). Most of these settlements were essentially suburbs and relied on nearby urban centers for services and occupation. The eastern cities of the Tel-Aviv metropolis therefore evolved rapidly from dormitory towns to developed urban centers. This process caused the agglomeration of small clusters within the area of these cities into large clusters, an example for such a city is Petah Tiqwa (see Figure 12). The agglomeration of small clusters within the municipality of Petah Tiqwa into one large cluster caused the agglomeration of the latter with the largest cluster in the metropolis in 1985.
The morphology of the largest cluster in the years from the mid 1980s onward can be viewed as a “quasi stationary state”. During this period the morphology of the largest cluster hardly changed. We suggest that this is due to the fact that there were no substantive parcels of land left to be developed. Protected agricultural land and national nature reserves occupy almost all of the available land. This situation is likely not to be sustainable over time. It is probable that market forces and pressure from private developers on the government will create additional developable land. In the third stage of the metropolis development, the only possibilities of development was to fill unoccupied land inside of the clusters (see Figure 5) and to construct buildings with significant heights (Czamanski & Roth, 2007).
Conclusions
To conclude, this work considers the urban area as a physical object, disregarding municipal boundaries. It is based on the assumption that the city is a complex system with self organizing characteristics. It reflects patterns of consistency and homogeneity in the perceptions, constraints and desires of people, as expressed by their behavior and decisions. This homogeneity results in great similarity, i.e., the urban clusters in different locations evolve in a similar way, which can be described mathematically. In addition, when clusters are fractals, their fractal dimension can be used in order to discover phenomena connected with their evolution.
From this study we suggest three important conclusions:
The built-up area of the largest cluster (and 1. its components) in the Tel-Aviv metropolis is indeed a self organizing system; although it was not affected by political and planning decisions (as clusters are not subject to municipal boundaries), it presented some common characteristics. This result was found in the morphology of the largest cluster through time as well as in the behavior of all the clusters in the Tel-Aviv metropolis.
The development of the morphology of the 2. largest cluster in the Tel-Aviv metropolis can be divided into 3 stages: 1935-1964, 1964-1985 and 1985-2000. These division correlates with the development of the entire metropolis morphology and can be associated with socio-economic trends and processes. Thus the cluster analysis has a significant potential to be used as a research tool to investigate urban development.
The largest cluster in the Tel-Aviv metrop3. olis has come to saturation in terms of land availability, i.e., there is no more available land for development within its boundaries. To enable further development the following options should be considered by the planning authorities:
Continue to construct buildings with a. increasing heights.
Regeneration of old neighborhoods b. that are characterized by houses with one or two floors.
Relocation activities that contain land c. uses that are not related to urban activities—such as military facilities, from the metropolis core (the largest cluster).