Are You Complexity-Minded? The Design, Development, and Evaluation of Measures to Survey Individual Worldview
Eric B. Dent, F. Mark Case, Ben Wilson, and Jacob Welch
Abstract
This article describes the development and initial validation of an instrument of individual worldview which incorporates the three constructs which primarily differentiate worldview - level of explanation, causation, and observation - that are deeply ingrained in people. Differences in worldview explain varying approaches to many organizational dynamics such as organizational capabilities, leadership behavior, logistics management, manufacturing, and others. Three studies were conducted to validate the instrument including using Thurstone-type and Likert-type approaches in the first two studies. The third study sampled 1,225 mostly American medical school faculty members. Confirmatory factor analysis of this sample provided convincing evidence of a good fit for the worldview model. This assessment can now be used to determine how complexity-minded people are in terms of their assumptions of a Traditional or an Emerging Worldview.
Theoretical Framework
Over the years, a number of scholars and researchers have called attention to the importance of the most deeply held beliefs of individuals (Bjurström, 2012; Lougheed, 2021). An individual’s worldview is the set of deeply held beliefs and fundamental assumptions which serve as a mental map for providing coherence to what the world and life are and how they work. An individual’s worldview is more deeply ingrained than attitudes, opinions, traits, and values (Golshani, 2020). It is also more difficult to access and much harder to change than any of these attributes. An individual’s worldview may be so deeply embedded within her that she literally can see no other way.
The contents of worldview are often philosophical in nature and may include the following abbreviated list: determinism, equality, belief in the transcendent (Schreiner, 2021), ecological perspective (Peterson, 2021), and hierarchical ordering. Although worldview includes a variety of such beliefs, a few assumptions make the greatest difference in ascertaining an individual’s worldview. The two primary worldviews characterized in the literature are labelled here the traditional (TWV) and the emerging (EWV) (Golshani, 2020). The three primary components are observation, causation, and level of explanation (Dent, 1999) (Table 1). Dent’s qualitative study found these three to be the most significant and resulted in him offering a definition of complexity science as “an approach to research, study, and perspective that makes the philosophical assumptions of the EWV” (p. 5). Many have suggested that the acceptance of EWV assumptions is critical for a continuation in the increase of workplace performance and the quality of life (Bjurström, 2012; Lougheed, 2021; Peterson, 2021). The contrasting assumptions of the TWV and EWV are shown in Table 1.
| Construct | TWV Assumptions | EWV Assumptions |
|---|---|---|
| Observation | Objective Observation | Perspectival Observation |
| Causation | Linear Causation | Mutual Causation |
| Level of Explanation | Reductionism | Holism |
Table 1 Assumptions of the TWV and EWV
Because the terminology is not common in the literature, the assumptions are briefly defined in Table 2.
| Assumption | Description |
|---|---|
| Reductionism | The belief that an entity can be divided into its composite parts and that a cumulative explanation of the composite parts fully explains the entity |
| Holism | The belief that an entity can be best understood by considering it in its entirety. The entity has "characteristics which belong to the system as a whole and don't belong to any of its parts" (Clemson, 1984: 24). These are essentially the definitions for level of explanation suggested by Garfinkel (1991), and Slife and Williams (1995). |
| Linear cause and effect | The expectation that the relationship between two (or more) phenomena is relatively linear (or that, for the relationship, a linear model, using few variables, serves as a useful approximation) and that temporal precedence of cause prior to effect is clearly distinguishable. |
| Mutual (or circular) cause and effect | The expectation that the relationship between two (or more) phenomena is heavily influenced by the presence of feedback loops. In other words, a variable may appear on both sides of the equation (meaning that cause and effect are, at least to some degree, a function of each other). These are essentially the definitions for causation suggested by Kitcher (1991) and Yip, Kwok, Chen, and Chen (2013). |
| Objective observation | The belief that phenomena or information in the world are independent of the method of observation of those phenomena or information. Moreover, the phenomena or information are not altered by the act of observing. |
| Perspectival observation | The belief that phenomena or information in the world are dependent upon the method of observation. Moreover, the phenomena or information may be changed by the act of observing. These are essentially the distinctions in observation made by Popper (1985a), Popper (1985b), and Wan, Hong, and Sternthal (2009). |
Table 2 Worldview assumption definitions
When decision makers hold assumptions that are not appropriate to the choices at hand, they are less likely, for example, to make an effective decision. Mismatches in assumptions have been implicated in the effectiveness of work practices in a non-profit organization (Rook, & Watson, 2017), found in the origin of organizational capabilities (Bleda, 2017), and observed in actual leadership behavior (Houglum, 2012). Worldview assumptions have important implications for how work is performed. Person A making TWV assumptions and Person B making EWV assumptions will have completely different approaches to logistics management (Nilsson & Christopher, 2018), manufacturing (Rose-Anderssen, Baldwin, & Ridgway, 2018), sustainability (Landrum, 2018; Porter, & Reischer, 2018), management (Bjurström, 2012), urban violence (Ugur, 2016), organizational innovation (Puustinen & Lehtimaki, 2016), school education (Fleener, 2016), and economics (Schultz, 2016). Dent (1999) contended that “...[I]f we are to continue to grow, develop, and thrive in this world we must adjust some of our most deeply held mental models about the world and our interactions with it” (p. 6).
Slife and Williams (1995) reported then that there had been no empirical efforts to measure individual worldview and its major constructs. The situation appears to have changed little. Worldview assessment, in terms of how complexity-minded someone is, is not a well-researched area. The research effort which comes closest is a Harvard Business Review article by Martin and Lodge (1975) who asked Harvard Business Review readers questions concerning Ideology I and Ideology II. Each of these ideologies contained several ideas. Ideology I is similar to the TWV and is provided here for illustrative purposes.
The community is no more than the sum of the individuals in it. Self-respect and fulfillment result from an essentially lonely struggle in which initiative and hard work pay off. The fit survive and if you don't survive, you are probably unfit. Property rights are sacred guarantor of individual rights, and, to satisfy consumer desires in an open market, the uses of property are best controlled by competition. The least government is the best. Reality is perceived and understood through the specialized activities of experts who dissect and analyze in objective study (p. 15).
Initially, a thorough review of Tests in Print IV (1994) and The Twelfth Mental Measurements Yearbook (Conoley & Impara, 1994) was conducted using the following terms: analysis, causation, epistemology, feedback, (w)holism, linear, mutual, objective, ontology, reductionism, subjective, synthesis, system, and worldview. Six relevant instruments were found. The names of the instruments and the underlying assumption they purport to tap are listed in Table 3. Later, The Twenty-first Mental Measurements Yearbook (Carlson, Geisinger, & Jonson, 2021) was thorough analyzed in a similar manner and this review resulted in no additions to Table 3. The authors also became aware of the Analysis Holism Scale (Choi et al., 2007) and have included it.
| Underlying Assumption | Measurement Instrument |
|---|---|
| Objectivity | Comprehensive Personality Profile (a secondary trait) Meyer-Kendall Assessment Survey Taylor-Johnson Temperament Analysis Guilford-Zimmerman Temperament Survey |
| Analysis - Synthesis | Analysis Holism Scale Woodcock-Johnson Psycho-Educational Battery, Test of Cognitive Ability |
| Systematicity | California Critical Thinking Disposition Inventory |
Table 3 Available Measurement Instruments in the Topical Area of this Research
Analysis of these instruments revealed that the definitions used for the same, or similar, words is very different than the definitions used here. For example, with the Meyer-Kendall Assessment Survey, “the Objectivity scale is one of two control scales for the MKAS. It is designed to measure the degree to which respondents consciously or unconsciously attempt to present themselves in a favorable light” (Conoley & Impara: 401). A score in the middle range is “most desirable.” Likewise, the Comprehensive Personality Profile describes objectivity as the ability to “look at all the different factors without getting personally involved” (p. 176). Objectivity is seen as a positive trait because it means individuals are “difficult to manipulate since they are not dependent upon the approval of others for their own identity” (p. 177). In this case, the higher the objectivity score, the better.
The Taylor-Johnson Temperament Analysis instrument defines objective as “fair-minded, reasonable, logical” and subjective as “emotional, illogical, self-absorbed” (Conoley & Impara: 677) On the California Critical Thinking Disposition Inventory, the systematicity scale “measures being organized, orderly, focused, and diligent in inquiry. No particular kind of organization, e.g. linear or non-linear, is given priority on the CCTDI” (p. 114). Clearly none of these existing instruments is at all a useful source of items for this research.
Because no test of worldview exists, this research developed an instrument which measures an individual's worldview as defined by the three major constructs - observation, causation, and level of explanation. Study 1 was a “proof of concept” since some colleagues had suggested that the TWV was no longer a view held by many educated people. Study 2 was a systematic process of creating scale items and validating them in numerous ways. It resulted in a 36-item scale that was tested in Study 3. The third study used 1,414 responses from mostly American medical faculty. A confirmatory factor analysis narrowed the scale to nine excellent items.
Measurement Instrument Development and Validation
Study 1
A 24-item Likert scale instrument was developed to test the feasibility of the conceptual framework, and the potential response bias about expressing TWV beliefs.
This version of the instrument was administered to 57 working professionals who all had at least two years of work experience. The conceptual framework was found to be worthy of further consideration. Of 57 respondents, 26 scored an EWV perspective, 30 a TWV, and one in the middle, indicating that people were willing to express TWV beliefs, suggesting that the TWV wasn’t just a “straw man” in contrast to being complexity-minded. Participants were invited to comment on the instrument, especially to raise any issues of misunderstanding, unclarity, or poor wording. The pretest showed that the language level was adequate (especially significant since some of the participants used English as their second language), the choice options were clear, and the instrument sustained interest among the participants. Everyone completed the instrument and only one item was left blank by one participant. The instrument was completed by everyone in about twenty minutes.
This study also created a desire to search for a way to achieve more shared agreement about the nature of the measurement items. Also, greater assurance was sought that items generated did not all fall in a narrow range of any of the constructs.
Study 2
In order to achieve these objectives, a second study was conducted in which the instrument combined aspects of a Thurstone-type approach and a Likert-type approach (Butcher, 1974: 258). The Thurstone-type features retained were, equal interval scaling over a wide range of response and the process for identifying unambiguous questions which have small standard deviations. The Likert method of scoring was employed because of its strength in allowing for a range of response.
Step #1 - Survey Creation
Scale items were created from brainstorming sessions with several colleagues and by scanning relevant sources in the literature. The objective in this case was to find statements that could be directly translated into items. The statement, “Truth is a matter of fitting words to the world” is essentially a paraphrase of Lakoff and Johnson (1980: 200). “Acting should precede planning because by acting we take part in constructing the context for our plans” is adapted from the work of Karl Weick as quoted by Wheatley (1992: 37). Likewise, “A full characterization of each individual’s behavior logically implies a knowledge of group behavior; there is nothing left out” is a direct quote of Kenneth Arrow’s included in Garfinkel (1991: 445).
Ultimately, through all of these methods, a total of nearly 200 items was generated. These items were then tested for clarity, appropriateness, understandability and other forms of suitability by analysis of several people running the gamut of sophisticated to novice reviewer. From this review items were deleted or reworded.
One hundred eighty items (55 for Observation, 62 for Causation, 63 for Explanation - exceeding the target of 150 items) were selected for continuation to the next phase.
Step #2 - Judges Meeting
The ensuing three validity reviews were provided by an assembled group of judges. Thirteen judges (knowledgeable at the doctoral level) were convened to work on the survey construction. The judges accomplished three important tasks:
- Further pilot-testing of the items
- Step #2a - “Reverse” mapping of the items. In this step, the judges were given the full list of items, randomized, and asked to map the items onto the three constructs.
- Step #2b - Thurstone ranking of the items.
Thirteen individuals provided data that are used in the analysis below. The average age of the judges was 41-50 and they averaged 16-20 years of work experience. Six of the judges were female and seven were male. Two of the judges reported that their formative years were influenced by a culture other than the United States and these were the cultures of China, West Africa (Liberia) and Haiti (one judge listed two countries).
Step #2a - Reverse Mapping
The reverse mapping step provided greater assurance of validity. Thirteen judges completed the reverse mapping task. One judge used the same response for 63% (113) of the items. This judge is a white male in his 50s. In the discussion that follows, the results from the single judge whose responses were atypical were not used.
Step #2b - Item Ranking
After the judges reverse mapped and tested the wording of the items, they ranked them according to how intensely the item measured the construct. Of the 12 judges who completed this task, again there was one who had responses that were inconsistent with the others. This judge is also a white male, age 51-60. The “corrected judge total correlation” for judge 12 for all 141 items was .3746, substantially lower than the next-least consistent judge, at .7412. Alphas for Observation, Causation, and Explanation were.9653, .9589, and .9653, respectively.
Step #3 - Item Elimination
Five criteria were used in determining which items to retain based on the judges’ ranking:
- Lower standard deviation of the means of the judges’ rankings
- Coverage of the scale
- Agreement with the researchers’ rankings
- A subsequent reading of the item to determine whether it was felt to be one of the better items.
- Balance of TWV and EWV items for a given construct.
The standard deviations of the means ranged from 0.7 to 3.5 with 89% of the standard deviations below 2.4. Based on the five criteria for item elimination an additional 22 questions were eliminated by the Thurstone-ranking step.
Step #4 - Survey Administration
The survey was administered to 200 respondents with at least three years of career-oriented work experience in an organization. Moreover, each respondent either had, or was completing, graduate education in management. The demographic characteristics of the 177 of the respondents who provided them are included in Table 4.
| Age (years) | Years of full-time work experience (years) | Race | Gender | ||||
|---|---|---|---|---|---|---|---|
| 21-30 | 43% | 3-7 | 43% | White | 89% | Female | 42% |
| 31-40 | 33% | 8-14 | 27% | African American | 2% | Male | 58% |
| 41-50 | 11% | 15-21 | 13% | Other | 5% | ||
| 51-60 | 7% | 22-28 | 9% | Hispanic | 3% | ||
| 61+ | 5% | 29+ | 9% | Pacific Islander | 1% | ||
| n=177 | |||||||
Table 4 Demographic Data about the Survey Respondents
Step #5 - Product-moment correlations
Questions were omitted if they were unanswered by at least five percent of the respondents. Next product-moment correlations were computed, and an alpha was calculated for the items in each of the hypothesized constructs. The alphas for Causation, Observation, and Explanation were 0.8365, 0.8685, and 0.8747, respectively.
Items were eliminated at this stage if the corrected item-total correlation was not at least 0.3. In the case of reductionism, however, which entered this step with the greatest number of items, 28, the cutoff could be made higher, at 0.33. A total of 33 items were removed because not enough respondents answered them, or their correlations were too low.
Step #6 - Principal Components Analysis (PCA)
The remaining 86 items were included in a principal components analysis (PCA). A scree plot analysis suggested that the interpretation should be limited to ten factors, at most. A six factor solution provides the best simple structure. The communalities are still in an acceptable range, mostly 0.3 to 0.5, and 31% of the common variance is explained. All six factors have an eigenvalue above 2.3. Again, the unexpected finding is that the six-factor oblique solution is essentially the same as the six-factor orthogonal solution, indicating that no meaningful correlation exists among the factors.
The next step was to determine whether it was possible to interpret the six factors since only three had been hypothesized. Upon examination, relatively obvious explanations for the extra factors surfaced. One factor was dominated by items which are certainly about observation, but specifically about observation as it pertains to the appraisal or assessment of something. Another factor was dominated by explanation, but specifically as it pertains to the context provided by the mission of a particular organization.
An interpretation for two other factors was not as obvious as the two identified thus far. Still, only a few moments of reflection suggested the following differentiation. In one factor, nearly all of the items focus on the reduction, or division taking place, without any reference to possible interrelationships or a broader context. For example, “it is not important for there to be fundamental ‘building blocks’ in nature” and performance is best obtained when “each department performs as well as it can.” This factor will be labeled “Explanation: Pieces.” Likewise, the items loading the other factor nearly all hint at the possibility of interrelationships or a broader context. For example, “you have to understand the wider world in which it operates,” and “one or more group abilities emerge...” This factor will be named “Explanation: Connections.”
Step #7 – Further Instrument Refinement
Cronbach alpha coefficients for the final instrument are listed on the diagonal in Table 5. The off-diagonal entries are the intercorrelations of the scales of worldview.
| Causation | Observation | Exp: Pieces | Exp: Connections | |
|---|---|---|---|---|
| Causation | (0.76) | |||
| Observation | 0.19* | (0.75) | ||
| Exp: Pieces | 0.45*** | 0.21** | (0.78) | |
| Exp: Connections | 0.02 | 0.20** | 0.40*** | (0.78) |
Table 5 Cronbach Alpha Coefficients and Intercorrelations of Scales of Worldview Note: Values in parentheses are Cronbach alpha coefficients. *p<0.05, **p<0.01, ***p<0.001
The final form of the instrument includes, for each factor, the first twelve items with factor loadings of at least 0.3.1 The instrument of individual worldview appears in Table 6.
| Explanation: Pieces | M | SD | Item-scale r |
|---|---|---|---|
| It is not important for there to be fundamental "building blocks” in nature. | 2.43 | 1.56 | 0.35 |
| *Big problems should be broken into pieces to solve them more easily. | 3.03 | 1.34 | 0.46 |
| *An organization will perform as well as possible if each department (i.e. suborganization) performs as well as it can. | 3.83 | 1.51 | 0.43 |
| *When studying an organization, it is important to study a section of it at a time. | 3.88 | 1.36 | 0.42 |
| *If every member of a work team performs at his/her maximum level, the work team will be functioning at its maximum level. | 4.12 | 1.69 | 0.34 |
| *All social psychology can be explained using principles of individual psychology. | 5.17 | 1.29 | 0.43 |
| Dividing a task into parts is not the best way to analyze it. | 3.54 | 1.39 | 0.45 |
| *When learning a complicated task, I prefer to learn pieces of the task separately, and then try to put it all together. | 3.68 | 1.64 | 0.36 |
| Each thing should be defined in relationship to something else, not by its inherent properties. | 3.33 | 1.48 | 0.26 |
| If an organization has a major problem in one department, it is better solved by a cross-functional team of experts selected from the entire organization than a team of employees in that department. | 4.25 | 1.45 | 0.34 |
| *Most things that happen in organizations can be traced to their root causes if we took the time. | 3.06 | 1.61 | 0.47 |
| Explanation: Connections | |||
| In order to understand an organization, you have to understand the wider world in which it operates. | 6.08 | 1.01 | 0.4 |
| If a group is solving a problem, one or more group abilities may emerge that are not present in any individual group member. | 5.85 | 0.87 | 0.47 |
| *A chief executive officer (CEO) can basically do his/her job without knowing the mission of the organization. | 6.36 | 1.05 | 0.34 |
| An effective organization functions more like a living being than a computer. | 5.69 | 1.07 | 0.47 |
| *When studying a beautiful painting, it is important to view a section of the painting at a time. | 5.39 | 1.37 | 0.33 |
| My work performance is higher if I understand the big picture which my work fits into. | 6.02 | 0.85 | 0.39 |
| *It is more important for military squad members to be trained in their roles separately than for them to train together. | 5.72 | 1.11 | 0.49 |
| The whole is more than the sum of its parts. | 5.62 | 1.48 | 0.45 |
| *It is more important for firefighters to be trained in their roles separately than for them to train together. | 5.57 | 1.1 | 0.41 |
| *Company C is formed by the merger of Company A and Company B. Company C can expect annual profits equal to Company A's annual profit plus Company B's annual profit. | 5.77 | 1.02 | 0.4 |
| It is more important for football players to practice as a team than it is for them to practice their positions separately. | 5.5 | 1.34 | 0.34 |
| *A government employee's spirituality does not enter into his or her workplace performance. | 5.44 | 1.37 | 0.33 |
| Causation | |||
| *If a team of vegetable pickers gets behind schedule on its work, adding extra pickers will speed up the job. | 3.41 | 1.48 | 0.48 |
| *If a team of mortgage application processors gets behind schedule on its work, adding extra processors will speed up the job. | 3.21 | 1.46 | 0.49 |
| If an organization lowers its prices, it will not increase its sales. | 2.84 | 1.28 | 0.43 |
| *Decreasing the drug problem in this country will also decrease the crime rate, decrease the rate of births out of wedlock, and decrease the unemployment rate. | 3.51 | 1.69 | 0.42 |
| *The higher an organization's advertising budget the higher its sales revenue. | 4.77 | 1.38 | 0.39 |
| *An employee who receives an above-average pay increase will work harder. | 4.35 | 1.33 | 0.42 |
| *The times in my life when I've worked the hardest are when I've achieved the most. | 3.42 | 1.74 | 0.43 |
| If a team of construction workers gets behind schedule on its work, adding extra workers will not speed up the job. | 3.49 | 1.46 | 0.4 |
| *Organizations should grow larger to obtain greater economies of scale. | 4.7 | 1.3 | 0.43 |
| The amount of effort I put into a task does not determine how well the task turns out. | 3.48 | 1.81 | 0.38 |
| It is likely that if two employees are achieving similar levels of exceptional performance, they are not using similar methods and approaches. | 4.07 | 1.63 | 0.31 |
| *Tax cuts for upper class income earners also benefit the middle and lower class income earners. | 4.3 | 1.74 | 0.32 |
| Observation | |||
| Beauty is in the eye of the beholder. In other words, different people identify different things as beautiful. | 6.26 | 0.91 | 0.31 |
| For things that happen in organizations, there is usually more than one side to every story. | 6.02 | 0.9 | 0.4 |
| People will interpret organizational events and situations differently. | 6.17 | 0.76 | 0.36 |
| Apparent facts can change depending on the way in which they are observed or measured. | 5.74 | 1.05 | 0.37 |
| There are rarely facts that everyone agrees on. Apparent facts will change depending upon people's perspectives and biases. | 4.98 | 1.49 | 0.46 |
| You have to "walk in someone else's shoes” (in other words, to live life from his or her perspective) to really understand her or him. | 5.06 | 1.35 | 0.31 |
| All people look at the world through their own "glasses." | 6.01 | 1.16 | 0.33 |
| Truth is not absolute or objective, but derived from people's understanding of things. | 4.82 | 1.91 | 0.41 |
| What is most important about any organizational event is not what happened but what it means. | 4.9 | 1.23 | 0.33 |
| The language of the imagination, especially metaphor, is necessary for expressing the unique and most personally significant aspects of our experience. | 5.16 | 1.34 | 0.38 |
| When important issues arise at work, my own impressions and intuitions are my guides for action. | 5.03 | 1.29 | 0.33 |
| *Anyone who closely studies this country should agree on its major problems. | 5.21 | 1.39 | 0.38 |
Table 6 47-Item Worldview Instrument, Scale Cronbach Alpha Coefficients, Means, Standard Deviations, and Corrected Item-Scale Correlations Note: M is on a Likert scale of 1 (strongly disagree) to 7 (strongly agree). *Items were reversed.
Study 3
Background and Methods
In order to perform a confirmatory factor analysis, a third study was completed in 2021 with the 36-item Likert scale survey. Oversight and approval were provided by the Boise State University Institutional Review Board in coordination with the Idaho College of Osteopathic Medicine. In this study, medical school faculty members, primarily from the United States, were invited by email to complete the survey, which included the study instrument, as well as the Analysis Holism Scale (Choi et al., 2007) and the Comprehensive Intellectual Humility Scale (Krumrei-Mancuso & Rouse, 2016). The vast majority of participants were contacted by using their publicly-available email addresses, and a few were recruited through a newsletter emailed to members of the International Association of Medical Science Educators. Respondents were recruited via email to participate in the survey, and offered an incentive of a $15.00 digital gift card.
Results
Of the 52,158 invitations that were emailed to medical school faculty members, there were 1,414 who submitted a survey. Due to the promise of confidentiality in the administration of the survey, the number of people who actually received the invitation is unknown (because of non-functioning email addresses, emails not opened, etc.), thus calculating the response rate using CASRO or any other method was not possible. There were 189 of the 1,414 respondents whose surveys were lacking answers to most items and were, therefore, not included as valid surveys, making the total number of completed surveys in the analysis 1225 with an adjusted response rate of 2.3%. Response rates for surveys among medical professionals are notoriously low (Kidd, Colley & Dennis, 2019). Even so, we found it advisable to check for any evidence of non-response bias by testing for significant differences between earlier and later respondents with respect to means and variances (Clottey & Grawe, 2014). All scale items were used to test for non-response bias, and no significant differences were found in any of the responses, clear indication of no evidence of non-response bias.
Discussion
Scale Development
A rigorous scale development project was done in Study 2 in which items assumed to reflect worldview via qualitative measures including Exploratory Factor Analysis (EFA). Study 3 focused on quantitative analysis using Confirmatory Factor Analysis (CFA) to see whether additional items should be removed from the scale, and to measure reliability and validity of the final scale.
Exploratory Factor Analysis
For details and insight into the qualitative development of this scale (including potential items, removal of items, and criteria used to make that assessment, please see Study 1 and Study 2. That qualitative study was done with a total of 200 beginning potential items, which were iteratively pared down through a process of analyzing interrater reliability, assessments of judges, and discussion amongst the researchers. In an exploratory factor analysis, a sample of 200 subjects with at least three years of career-oriented work experience in an organization was used in the reduction of potential items for use in the scale. The item reduction process for that study resulted in 36 items in a three-factor model.
This work used a separate sample of 1,225 subjects and yielded a different factor structure than the original study. As noted earlier, the original scale items totaled 36, of which 27 were removed due to low communalities, cross loadings, or low factor loading. The remaining 9 items were consistent with the three-factor model presented in the first study, giving cursory indication that the scale is potentially viable. EFA was conducted using orthogonal rotation with principal components extraction. The resulting factor analysis showed the hypothesized factors clearly supported with nine items; WR4, WR17, WR25, and WR28 loading on the first factor (EXPL). The second factor (OBS) showed WR10, WR13, and WR35 loading on it. The last factor (CAUS) is associated with WR 24, and WR32. These items are provided in Table 7. Reverse scored items were transposed to minimize the probability of highly correlated error terms (Jarvis & Petty, 1996), and to meet covariance requirements for reliability analysis.
In this analysis, KMO and Bartlett’s test indicated the appropriateness of using factor analysis. KMO was 0.651, and Bartlett’s test was 1865.55 with 36 df, p <0.001. The rotated component matrix is shown in Table 7. In it we can see that the nine items in the scale all have factor loadings >0.6. The total variance explained by this three-factor model is 59.6%, and all communalities are 0.42 or higher (up to 0.756). Each factor has an eigenvalue greater than 1 as seen in the scree plot (Figure 1).
| Variable | EXPL | OBS | CAU | |
| WR4 | "All people look at the world through their own ‘glasses'” | 0.650 | 0.097 | -0.058 |
| WR13 | "If a team of construction workers gets behind schedule on its work, adding extra workers will not necessarily speed up the job” | 0.166 | 0.622 | -0.079 |
| WR17 | "Beauty is in the eye of the beholder. In other words, different people identify different things as beautiful” | 0.626 | -0.041 | 0.113 |
| WR24 | "It is more important for firefighters to be trained in their roles separately than for them to train together” | 0.104 | 0.005 | 0.863 |
| WR25 | "For things that happen in organizations, there is usually one side to every story” | 0.738 | 0.083 | 0.165 |
| WR28 | "People will interpret organizational events and situations differently” | 0.780 | 0.070 | 0.100 |
| WR32 | "It is more important for military squad members to be trained in their roles separately than for them to train together” | 0.124 | 0.005 | 0.860 |
| WR35 | "If a team of mortgage application processors gets behind schedule on its work, adding extra processors will speed up the job” | -0.064 | 0.826 | 0.092 |
Table 7 EFA Rotated Component Matrix
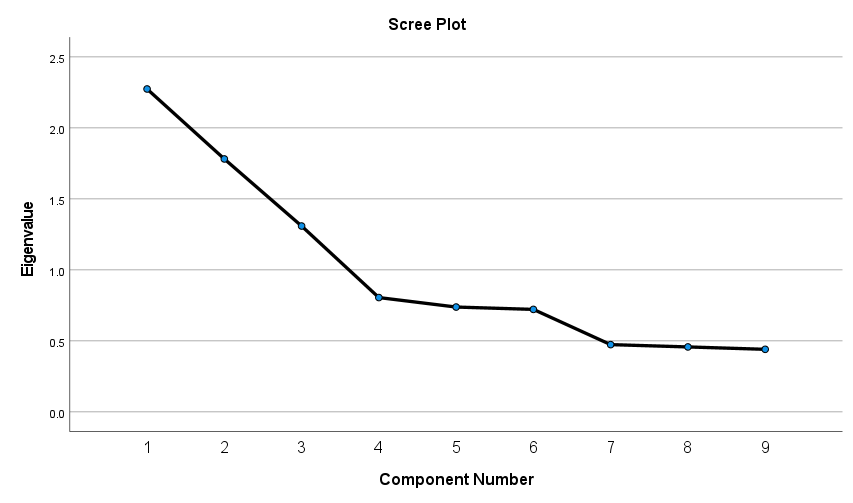
Figure 1 Scree Plot
Reliability of the factors was assessed using Cronbach’s Alpha. For the three hypothesized dimensions the alpha estimates are 0.659 for factor 1 (EXPL), 0.631 for factor 2 (OBS), and 0.694 for factor 3 (CAUS).
Confirmatory Factor Analysis
Confirmatory Factor Analysis was conducted using AMOS 27. The path diagram for the model that was estimated is shown in Figure 2. The estimation of this model provided very convincing evidence of a good fit, with a chi-square of 76.4 (df = 24, p <0.001), and a GFI of 0.986. RMSEA was 0.042, with the 90% confidence interval between 0.032 (lower limit) and 0.053 (upper limit). PCLOSE is 0.866, exceeding the threshold of 0.5 by a meaningful amount. Other fit indices are shown in Table 8.
Standardized regression weights are shown in Table 9, and factor covariances in Table 10. In total, these analyses strongly support this scale as reliable for measuring worldview.
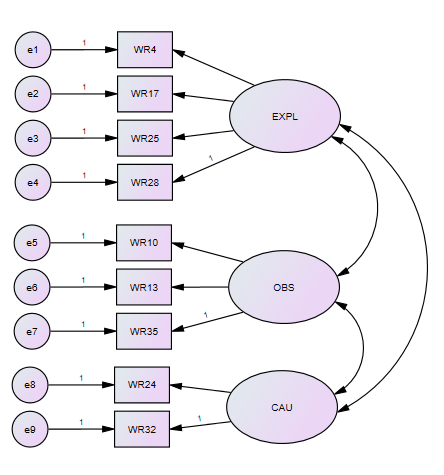
Figure 2 CFA Path Diagram
This model produced one significant covariance between factors: EXPL and CAU. The correlation coefficient was -0.337; significant but weak and inverse in direction.
| RMR | AGFI | NFI | IFI | TLI | CFI | PNFI |
|---|---|---|---|---|---|---|
| 0.041 | 0.974 | 0.959 | 0.972 | 0.957 | 0.971 | 0.639 |
Table 8 CFA Fit Indices
| Factor 1: EXPL | |
| WR4 | 0.424 |
| WR17 | 0.458 |
| WR25 | 0.699 |
| WR 28 | 0.741 |
| Factor 2: OBS | |
| WR10 | 0.741 |
| WR13 | -0.376 |
| WR35 | 0.744 |
| Factor 3: CAUS | |
| WR24 | 0.700 |
| WR32 | 0.760 |
Table 9 CFA Standardized Regression Weights
| Estimate | S.E. | p | |
|---|---|---|---|
| EXPL - CAU | -0.178 | 0.025 | <0.001 |
| EXPL - OBS | 0.015 | 0.022 | 0.490 |
| OBS - CAU | 0.038 | 0.035 | 0.289 |
Table 10 CFA Factor Covariances
Limitations of the Study
Every effort has been made to make this research study comprehensive, thorough, and applicable. Still, any study has limitations. Foremost on the list of limitations for this study is the usefulness of the conceptualization of the TWV and the EWV. The measurement instrument is dependent on these different worldviews. Furthermore, the original items were limited to the three constructs that are plausible proxies for worldview.
Another limitation of the study listed is that the research topic is about the existence of two different worldviews, yet it is studied using tools from only the TWV. This is, in fact, a serious limitation. We would also note that Clegg (1990: 21) has suggested that the analysis of postmodern social forms such as the EWV can be conducted with or without postmodern methods. One complexity-based approach to understanding worldview would be seeing it as a polarity (Johnson, 2020). From this perspective, the dimensions would not be continua. As illustrated in Figure 3, Level of Explanation would not be either reductionistic or holistic. The complexity perspective would mean seeing the phenomenon as a polarity and striving for the positives of both reductionism and holism. Johnson noted that each side of a polarity has its advantages and disadvantages. When a phenomenon is seen as having more disadvantages than advantages, managers characterize it as a “problem” to be solved, when in fact it is a polarity to be managed, indefinitely. For example, excessive conformity and loss of initiative are the disadvantages of holism. If these can be managed appropriately, they can be converted into synergy and creativity.
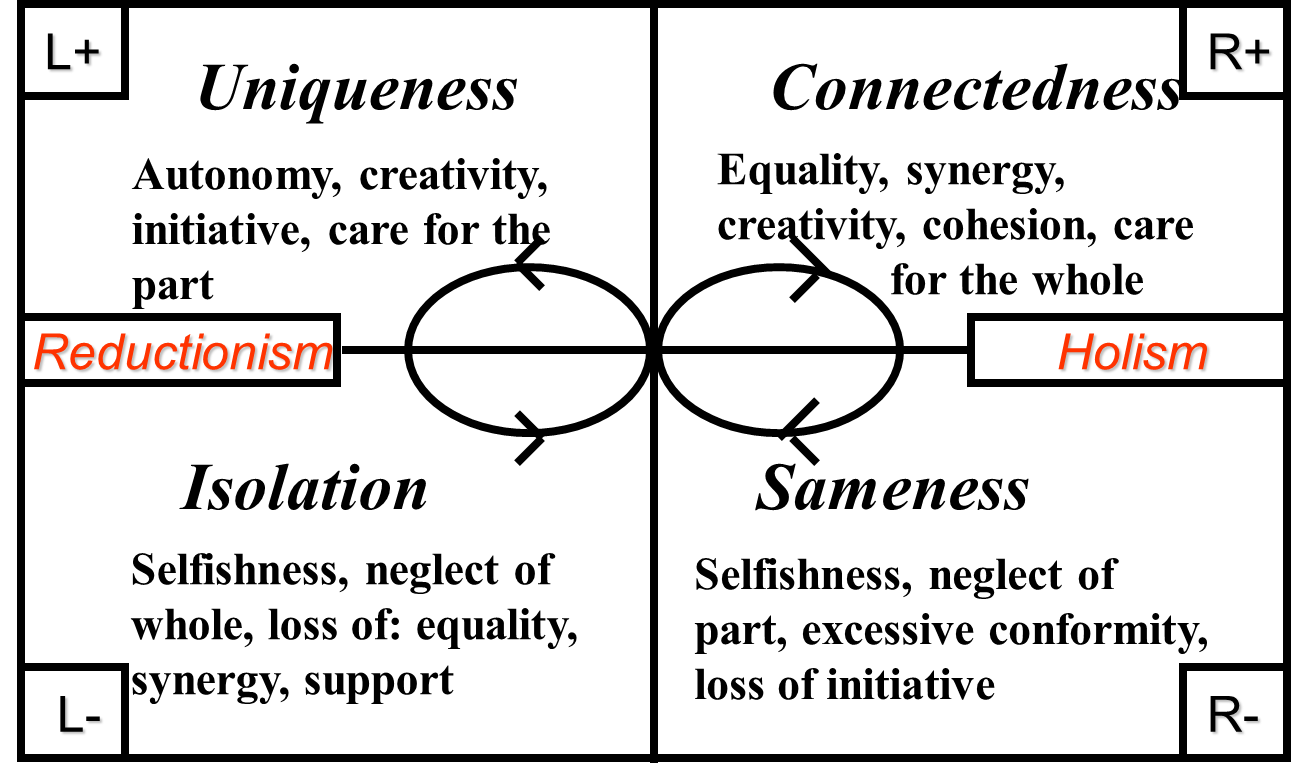
Figure 3 Level of Explanation (Reductionism and Holism) as a Polarity
The instrument can also be refined to include more dimensions of worldview. Although three constructs were identified as the most important representatives (Dent, 1999), the instrument would only be enhanced by the inclusion of additional dimensions. A candidate for the fourth most important construct could have assumptions of “competition” and “cooperation.” In other words, do people assume “that the world is hostile, that we are in a constant struggle for survival, that the consequence of error is death, that the environment seeks our destruction” (Wheatley and Kellner-Rogers, 1996: 11)? Or, do people assume that “we are here to create, not to defend ... [that we are in] a world that delights in its explorations. A world that makes it up as it goes along. A world that welcomes us into the exploration as good partners” (Wheatley & Kellner-Rogers, 1996: 11)?
Another enhancement which would add to the utility of the instrument would be to establish criterion-related validity. For example, suppose that EWV assumptions are more helpful in very dynamic work environments. Then, people with high scores on the EWV assumptions might correlate with job performance in those environments. Likewise, people with high scores on the TWV assumptions might be those who perform well in stable work environments. If correlations such as these could be identified, the Scale could be an additional tool to assist an organization in matching people to jobs they will succeed in and enjoy.
Worldview Measurement Applications and Future Research
Now that an assessment has been validated that can determine how complexity-minded an individual is, the possibilities are endless, to be trite. Organizations and consultants could add this to the battery of assessments they typically use for leadership and employee development. Just as such organizations intend for their leaders and employees to improve in change management, conflict management, diversity appreciation, and others, as shown above, they will gain advantage if their staff become more complexity-minded. Employees could complete the assessment initially, have a developmental plan to improve, and retake the assessment to determine whether there has been progress.
The number of research possibilities provides the broadest use. Physicians could be studied to see how their worldview affects their treatment of patients. Does a doctor who assumes linear causality have a more mechanistic view of patients and end up treating them more like a machine? Are physicians with M.D. training less holistic than those with D.O. educational preparation? What is the impact on health outcomes for these and other possible worldview differences? Does worldview affect a person's trust of scientific research and does it underlie a person's decision to avoid receiving a vaccination that could be protective in a pandemic?
Beyond medicine, does a person’s worldview lead them to one political position or another? Are deep political disagreements simply a reflection of deeply differing worldviews in terms of causation, observation, and level of explanation? For example, do people with one particular view of causation believe that a particular set of factors leads an individual to fall into poverty while other people with a differing view of causation see falling into poverty as a result of a different set of factors?
For organizations, important research is still needed to determine how to influence a worldview perspective. How can people who see observations objectively be trained to see objective observation and perspectival observation as a polarity? What educational experiences, organizational training, on-the-job experiences, stretch assignments, and other possibilities provide such employee and human growth? With this newly validated method of measuring complexity-mindedness, the opportunity exists not only to investigate the questions posed here, but to continue expanding the applications for worldview analysis to further understand the world at large.
References
Bleda, M. (2017). "A complex evolutionary view of the origin and developments of organizational capabilities," Emergence: Complexity & Organization, ISSN 1521-3250, 19(1): 41-65.
Butcher, H.J. (1974). "A note on the scale product and related methods of scoring attitude scales," in Gary M. Maranell (ed.), Scaling: A Sourcebook for Behavioral Scientists, ISBN 9781315128948.
Bjurström, E. (2012). "Minding the contexts of mindfulness in quality management," The International Journal of Quality & Reliability Management, ISSN 0265-671X, 29(6): 699-713.
Carlson, J.F., Geisinger, K.F., and Jonson, J.L. (2021). The Twenty-First Mental Measurements Yearbook (21st edition), ISBN 9780910674683.
Choi, I.K.M., and Jong, A.C. (2007). "Individual differences in analytic versus holistic thinking," Personality and Social Psychology Bulletin, ISSN 0146-1672, 33(5): 691-705.
Clegg, S.R. (1990). Modern Organizations: Organization Studies in the Postmodern World, ISBN 9780803983304.
Clemson, B. (1984). Cybernetics: A New Management Tool, ISBN 9780856261664.
Clottey, T.A., and Grawe, S.J. (2014). "Non-response bias assessment in logistics survey research: Use fewer tests?" International Journal of Physical Distribution & Logistics Management, ISSN 0960-0035, 44(5): 412-426.
Conoley, J.C., and Impara, J.C., Jr. (Eds.) (1994). The Twelfth Mental Measurement Yearbook, ISBN 9780910674409.
Dent, E.B. (1999). "Complexity science: A worldview shift," Emergence: A Journal of Complexity Issues in Organizations and Management, ISSN 1521-3250, 1(4): 5-19.
Fleener, J. (2016). "Addressing educations' most intractable problems: a case of failing schools," Emergence: Complexity & Organization, ISSN 1521-3250, 18(3-4): 1-23.
Garfinkel, A. (1991). "Reductionism," in R. Boyd, P. Gasper, and J.D. Trout (eds.), The philosophy of science, ISBN 9780262521567, pp. 443-459.
Golshani, M. (2020). "Science needs a comprehensive worldview," Theology & Science, ISSN 1474-6719, 18(3): 438-447.
Houglum, D.T. (2012). "Myth-busters: Traditional and emergent leadership," Emergence: Complexity & Organization, ISSN 1521-3250, 14(2): 25-39.
Jarvis, W.B.G., and Petty, R.E. (1996). "The need to evaluate," Journal of Personality and Social Psychology, ISSN 0022-3514, 70(1): 172-194.
Johnson, B. (2020). And: Making a Difference by Leveraging Polarity, Paradox or Dilemma, ISBN 9781610144575.
Kidd, J.C., Colley, S., and Dennis, S. (2019). "Surveying allied health professionals within a public health service: What works best, paper or online?” Evaluation & the Health Professions, ISSN: 1552-3918, 44(3): 226-234.
Kitcher, P. (1991). "The pragmatics of explanation," in R. Boyd, P. Gasper, and J.D. Trout (eds.), The Philosophy of Science, ISBN 9780262521567, pp. 317-328.
Krumrei-Mancuso, E.J., and Rouse, S.V. (2016). Comprehensive Intellectual Humility Scale [Data set], American Psychological Association.
Lakoff, G., and Johnson, M. (1980). Metaphors We Live By, ISBN 9780226468013.
Landrum, N.E. (2018). "Stages of corporate sustainability: Integrating the strong sustainability worldview," Organization & Environment, ISSN 1552-7417, 31(4): 287-313.
Lougheed, K. (2021). "The epistemic benefits of worldview disagreement," Social Epistemology, ISSN 0269-1728, 35(1): 85-98.
Martin, W.F., and Lodge, G.C. (1975, November). "Our society in 1985: Business may not like it," Harvard Business Review, ISSN 0017-8012, 143-152.
Murphy, L.L., Conoley, J.C., and Impara, J.C., Jr. (eds.) (1994). Tests in Print IV, ISBN 9780910674539.
Nilsson, F., and Christopher, M. (2018). "Rethinking logistics management: Towards a strategic mind-set for logistics effectiveness and innovation," Emergence: Complexity & Organization, ISSN 1521-3250, 20(2).
Peterson, K.R. (2021). "The very idea of an ecological worldview," Ethics & the Environment, ISSN 1535-5306, 26(1): 21–55.
Popper, K.R. (1985a). “Truth and approximation to truth,” in D. Miller (ed.), Popper Selections, ISBN 9780691020310, pp. 181-198.
Popper, K.R. (1985b). “Realism,” in D. Miller (ed.), Popper Selections, ISBN 9780691020310, pp. 220-225.
Porter, T., and Reischer, R. (2018). "We can't get here from there: Sustainability from complexity vs. conventional perspectives," Emergence: Complexity & Organization, ISSN 1521-3250, 20(1): 33-45.
Puustinen, A., and Lehtimaki, H. (2016). "Success and failure? a complexity perspective on an organizational innovation blockage," Emergence: Complexity & Organization, ISSN 1521-3250, 18(3-4): 83-102.
Rose-Anderssen, C., Baldwin, J., and Ridgway, K. (2018). "Complex systems, evolution and the management of manufacturing change," Emergence: Complexity & Organization, ISSN 1521-3250, 20(2).
Rook, L., and Watson, G. (2017). "Chaotic edge thinking: Understanding why work practices fail," Emergence: Complexity & Organization, ISSN 1521-3250, 19(3-4): 19-50.
Schreiner, D. (2021). "A worldview approach to science and scripture," Perspectives on Science & Christian Faith, ISSN 0892-2675, 73(1): 49-50.
Schultz, R. (2016). "Adjacent opportunities (18.1): 2nd order economics," Emergence: Complexity & Organization, ISSN 1521 3250, 18(1): 112-114.
Slife, B. D., and Williams, R. N. (1995). What’s Behind the Research: Discovering Hidden Assumptions in the Behavioral Sciences, ISBN 9780803958630.
Ugur, L. (2016). "Managing complexity: A case for adaptive management in tackling urban violence in South Africa," Emergence: Complexity & Organization, ISSN 1521-3250, 18(3-4): 24-53.
Wan, E. W., Hong, J., and Sternthal, B. (2009). "The effect of regulatory orientation and decision strategy on brand judgments," Journal of Consumer Research, ISSN 0093-5301, 35(6), 1026–1038.
Wheatley, M. J. (1992). Leadership and the New Science: Learning about Organization from an Orderly Universe, ISBN 9781881052449.
Wheatley, M. J. and Kellner-Rogers, M. (1996). A Simpler Way, ISBN 9781881052951.
Yip, P.S.F., Kwok, S.S.M., Chen, F., Xu, X., and Chen, Y.-Y. (2013). "A study on the mutual causation of suicide reporting and suicide incidences," Journal of Affective Disorders, ISSN 0165-0327, 148(1), 98-103.