Introduction
The topic of urbanization and therewith also urban energy systems shift continuously into society’s focus because half of the world’s population lives in cities today1 . Three quarters of the world energy consumption takes place in cities, being the case for 80% of greenhouse gas emissions. Estimations predict the share of population living in cities to rise to 70% on average and up to 85% in industrialized countries by 20508 . These numbers show clearly the growing importance of an urban energy system which is not only effective and efficient but at the same time also adaptable to new technologies.
An urban energy system can be described as the combined process of supply and demand of energy services to cover the given needs of a city’s population7 . This process includes the production, transport and storage of resources as well as the actual conversion into the final end use energy, usually heat and electricity. Cities are mainly passive energy consumers with all the power plants outside the urban borders but can increasingly be regarded as an opportunity for many energy transformation units supplying energy locally right where it is needed5 . So distributed energy generation is becoming an important topic for sustainable use of energy. At the same time this energy system has to fit the needs of the population and the available infrastructure e.g., building characteristics which differ from city to city. Besides the technological aspect, the different existing markets, institutions, consumer behaviors and cultural aspects need to be taken into account since in the end the energy has to be used by the people.
Therefore, in order to find smart energy solution, the consideration of these facets of an urban energy system becomes one of the great challenges of today’s city planners. Failures are not excusable as the supply of electricity, heating, transport fuel and other energy services is expected to function all times, at low cost and in an environmental friendly and sustainable way.
Urban Energy Transition
Many cities of the industrialized countries are in a process of transforming their energy systems, integrating new technologies and making them adaptable for future technological developments. The high spatial concentration of energy provision offers big potential for system integration and optimization by using the possible synergy effects of various technologies6 . However, the markets themselves are not very efficient in creating a sustainable infrastructure for the energy sector, therefore, many local governments create a so called “Master Plan”, outlining a long term vision for the city’s energy infrastructure, to which all planners and investors have to adhere. Being a top-down approach, these Master Plans are first of all politically motivated documents, which focus on achieving given targets, e.g., CO2-emission reductions or higher shares of electric mobility. Originating from these targets, a set of milestones and measures is derived, such as the implementation of certain green technologies or refurbishments of buildings. These measures are usually a combination of financial incentives for certain technologies and a wide spread information campaign for the city’s population.
Technologies
A wide variety of technologies can be used to achieve an effective energy system transition. Some of them only replace older technologies, whereas others require a whole different system setup, such as a Smart Grid. The different sectors, e.g., mobility, energy conversion, energy distribution, energy efficiency in buildings and energy demand need to be taken into consideration. In our proposed model all sectors except the mobility sector are represented, which provides a high range of possibilities to simulate the energy system of any given city.
Mobility
In most cities the transformation of the mobility sector plays a key role in their Master Plan. Major components of this sector are the implementation of biogas-driven or electric vehicles, the development of infrastructure for bicycles or the extension of the public transportation system. A current development in combination with electric vehicles is car sharing systems, which can reduce traffic, parking problems and the overall number of cars within a city.
Energy Distribution and Storage
Both heating and electricity grids are subject to major changes in the transformation of a city’s energy system. Modern heating supply consists of a combination of a district heating network and locally produced heat (e.g., Micro-CHP). The district heating network is fed by power plants in and outside the city as well as industries or other production sites with large amounts of waste heat. However the implementation of such a network is very cost-intensive, as the entire infrastructure has to be built underground and is therefore especially suited for areas with a high population density. In combination with heat storage, this technology becomes even more effective as the fluctuations and mismatches between supply and demand can be mitigated.
The electricity grid, especially the distribution system, is modernized by introducing so-called smart grid concepts, which incorporates many different technologies and provides the opportunity to link and regulate electricity demand, supply, transmission and storage. For example when assuming a widespread integration of electric vehicles this concept has a large potential, because the car batteries can serve as a decentralized storage (V2G), or to better adapt the system to fluctuating renewable energy sources, injecting power at low grid levels.
Energy Conversion
In the context of urban energy transition, the relevant technologies focus mainly on renewable energy sources. The trend turns evidently towards a large number of small energy conversion units instead of only a few big power plants, which has the advantage that both the energy supply and demand sites are closely located, so that transmission line capacity can be reduced. On the other hand, smaller production units usually have lower degrees of efficiency. In addition, renewable sources have a much lower energy density than fossil fuels, whereas the city itself has a very large energy demand density, especially with many tall buildings. Depending on the geographic location, topology or climate of the city some of the technologies are suited better for a city than others.
The use of hydro power is rather uncommon in inner-city areas as a steep topography is necessary and at the same time ships should be able to pass the hydro power plant thus requiring a large area. If however the conditions are suitable, this technology can serve as base load provider all year long.
The use of wind power within the city boundaries is also not very common, yet in close distance just outside the city it is a common and useful technology. The urban topography reduces the wind speed so minimum criteria for cost-effective wind turbines cannot be met9 . However, some European cities (e.g., Kassel, Germany) are connected to offshore wind power located hundreds of kilometers away.
Solar technologies, both photovoltaic and solar thermal panels are already widely installed in many urban areas and exhibit a large potential. This technology can be incorporated in many ways- from street lighting, solar water heating to building integrated panels. Already now there are some cities which are referred to as “Solar City” (e.g., Linz-Pichling, Austria3 ) having installed large amounts of solar panels or even a complete solar value chain including zero operational emissions solar panel factories (e.g., Freiburg, Germany). In contrast to photovoltaic, solar thermal installations are usually used locally and without feeding into the grid. This requires an exact dimensioning of the unit, in particular, with regard to possible feedback effects of other measures, such as establishing a district heating network, use of micro-CHP units or the refurbishment of buildings. In combination with further technologies, such as a heat engine or a chiller, other usable energy forms (i.e., electricity, cooling) are possible.
A rather traditional way of providing heat and electricity is the combustion of biomass, which has a unique feature of diversity. The resources come from a variety of feedstocks and are characterized by different energy densities, environmental constraints and many other factors. In contrast to other renewable energy sources, biomass is highly dependent on its location and whether the feedstock is combustible in the existing power plants. The most common urban biomass feed stocks are biodegradable municipal waste (i.e., paper, food, and textile), urban wood waste, waste vegetable oils or sewage sludge2 (i.e., by-product of wastewater product treatment).
Energy Efficiency in buildings and Energy Demand
In addition to the optimization of the supply side, the regulation and reduction of energy demand plays a crucial role within the sustainable and efficient urban energy system transition. One of the key factors for a successful system transformation is that the demand and supply side are being developed hand in hand with a clear and thoroughly elaborated plan, because a mismatch can lead to considerable system inefficiencies. City planners can regulate the energy demand either directly, e.g., through better insulation of public buildings or indirectly, e.g., providing incentives for efficiency measures or prescription through building codes.
As a first set of measures, it is possible to reduce the electricity demand by changing electrical devices, such as refrigerator, stove, television or washing machine. For many devices the saved energy even pays back the additional investment over its lifetime. As a second set of measures the buildings themselves can be equipped with a better insulation for walls, ceiling, doors and windows, in order to reduce overall heating demand. Thirdly the buildings refurbishment often includes improvements of the building’s technical system via special measures such as a ventilation system with waste heat recovery or the optimization of the hydraulic components of the existing heating components.
The goal of this work is to elaborate a model, which allows analysis of a Master Plan from a bottom-up perspective and thereby to assess the plan with regards to its feasibility, while identifying possible bottlenecks in its implementation. The results can then serve the city planners to adapt their planning in order to avoid unforeseen problems, when putting the plan’s measures into practice.
Model Description
The approach pursued in this research is a combination of system dynamics and agent-based simulation model of the city’s energy system, using the system dynamics approach to represent dynamics at macro scale and flow processes at individual scale, and the agent-based approach to represent a high spatial and temporal granularity. The model is developed with the multi-method modeling tool Anylogic and with Geographic Information System (GIS). The city itself is represented with its existing building and power infrastructure, which is then subject to the planned measures and developments. The core of the model implements on one hand different energy generation technologies, both fossil fuels and renewables, reaching from big power plants to small local PV-installations on a private household’s roof. On the other hand, the heat and electricity consumers are represented through the buildings.
Spatial Scale
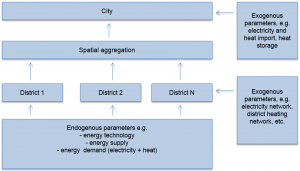
Conceptually the model is divided into two spatial levels or scales: at first, the city as a whole which contains the large power plants as well as the electricity and district heating network. Secondly, the city is divided into a deliberate number of districts or neighborhoods which are represented by nodes and connected to each other through power lines. These spatial aspects have been addressed using the GIS, e.g., to identify and map the individual buildings and number of inhabitants of each district, including their heat and electricity demand, etc. The information on the locally installed electricity and heating production units in each district is also available.
Conceptual?structure?of?the?model
With this structure it is possible to analyze a city’s master on any given geographic level–from building level to the entire city, depending on data availability and goal of the analysis.
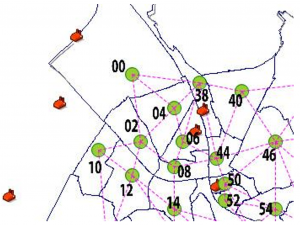
The?spatial?scale?of?the?model?structure
Small grey polygons represent urban districts; green circles are the center of each district which are interconnected by red lines representing power lines. The combination of all districts represents the city.
Model at District Level
The modelling framework requires partitioning of the city into a number of zones, districts or neighborhood. The partition can be accomplished considering, e.g., equal number of population living in each zone or according to administrative districts. For this model, the administrative district as depicted in Fig. 2 is considered as the smallest unit and the building data which provides the demand for different energy services for each district is accumulated. Fig. 3 illustrates the electricity demand (left), and heating demand (right). The demand per district is calculated by the accumulated building demand and split into hourly demand via standard load curves for the different building types and the respective weekday and calendar season4 .
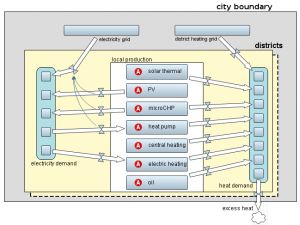
These demands are partly met by locally produced electricity and heat, through the relevant technologies (Fig. 3, center). For electricity the local energy units are guaranteed a priority feed for, before the remaining amount is covered by consuming from the grid on the city level. In the case of a surplus within a district, the electricity is fed into the city grid from where it can be distributed to other districts. The heating supply is solved through exact information for each building. Not all districts might be connected to the district heating network which is usually only developed where the population density is high enough and the infrastructural framework fits. Therefore the geographic distribution of heat supply technologies is usually very unbalanced. A possible local heating surplus is not fed into the grid but is dismissed as waste heat. The local technologies which are represented in the model are solar installations, heat pumps, micro CHP units, direct electricity heating, oil and the standard gas heater. Solar installations usually are not considered the primary source of energy supply as these are highly dependent on external conditions. In addition to parameters such as efficiency or the installed capacity, the model provides the opportunity to enter information about the solar potential for each district. In combination with information on the perspective annual growth rate, a realistic development for the next years and decades can be simulated.
Model?flowchart?diagram?at?the?district?level
Model at City Level
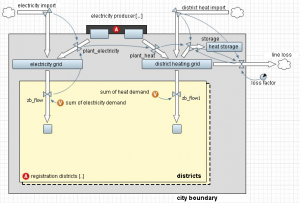
The city itself is modeled as a stock and flow diagram (Fig. 4). All sources and sinks of energy flows are represented by stocks (rectangles), whereas the energy transport is displayed by the flows (arrows). The electricity and district heating network are represented by stocks as well, which are always kept at zero, since the inflow equals the outflow at all times. Thus it is ensured that demand always equals supply and no energy is stored within the grid. Whereas this assumption is valid for the electricity grid, the district heating network partially serves as a small heat storage itself when all the pipes are filled with hot water or steam. Interfaces over the city’s boundaries exist through electricity and heat import (as the sum of all imports minus the exports) as well as transmission losses. As most cities traditionally are net importers this number is usually positive.
The energy demand for both electricity and heating equals the accumulated demand in the single districts minus the locally produced effective energy which is used directly in the districts. Therefore the city only provides the share of the demand which the districts consume from the power grid.
For energy supply the single power plants are instantiated in the model which produce the accumulated electricity needed by the single districts dynamically. If the demand exceeds the combined capacities of all power plants, additional electricity is imported from the national grid. The heat production by the power plants depends on their electricity production. If a plant is running at full load for electricity, also the entire capacity for heat is used. If it is running at partial load, the share of the heat capacity is used as well. In contrast to the electricity network, there is a heat reservoir within the city which is able to store a large amount of heat. Thus a considerable amount of the heat can be stored on warmer days, while it is used in colder days.
Model?flowchart?diagram?at?the?city?level
Results
Depending on the goal of the analysis, the model is able to retrieve very detailed information, e.g., heat or electricity load curves, effects of urban energy transition measures, etc. for single district or the entire city. Some such typical modelling outcomes are discussed.
District Level
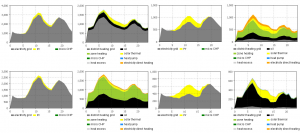
Four districts of a city are shown in Fig. 5 with their electricity (left) and heating (right) load profiles. Whereas for the electricity supply, the common picture is quite homogeneous—supply from the grid with an addition from PV during the day - the geographic distribution of the heating supply varies tremendously within a city. In one district almost completely covered by district heating (top left), while for another gas heating (bottom left) or oil heating (bottom right) dominates.
The graphs demonstrate clearly that an energy system transition cannot be executed as a set of measures which is uniformly applied all over a city, but rather an individually arranged plan for each of the districts or even for the single or group of buildings. Nonetheless some technologies are not suitable for some areas, e.g., district heating in less populated areas; while others can be applied practically anywhere in the city, almost independent of building type, e.g., solar installations.
Load?curves?for?four?example?districts
Left side: electricity load curve; Right side: heating load curve
City Level
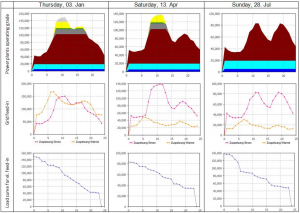
At the city level the information about energy demand from the districts is aggregated and used to run the power plants. In Fig. 6 some example load curves for different weekdays and seasons are depicted.
In this example the two hydro power plants and the first coal power plant serve as traditional base load suppliers, while the second coal power plant, the biomass and gas power plants are peak load providers. Electricity import is only made use of in extreme peak times during the weekdays. One goal of the energy system transition is to flatten the load curves, since high load changes usually entail inefficiencies and therewith additional and unwanted costs. This goal can be reached by boosting local electricity production during the peak times, e.g., through photovoltaic units.
Load?curves?(24h)?on?city?level?for?different?days?of?the?year
Top—Power plant load curves with different types of energy carriers (Blue: Hydro power; Red and dark Grey: coal; Green: biomass; Yellow: gas; light Grey: electricity import)
Middle—Feed-in load curves from the grid to the districts (Pink: electricity; Orange: heating)
Bottom—Ordered load curve for electricity feed-in
Effects of the urban energy system transition
The main purpose of the model is to simulate a city’s energy system and to analyze the effects of the measures which are outlined in the Master Plan. Two such measures are studied and simulated in this research for an exemplar city Master Plan.
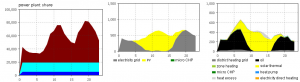
The solar offensive measures in the Master Plan suggest photovoltaic electricity production up to 14 kWp until 2025 and to cover an area of 140.000 m² with solar thermal panels. The effects of this measures can be seen directly both on qualitative and quantitative level (Fig. 7). Inspecting and comparing the previous example in Fig. 6 on the 28 Jul 2013, a flattening of the curve is visible, as the first peak from 10-12 am is about 7.000 kW lower than before. Regarding the district level we now even have the case of a slight overproduction within some of the districts, which creates losses in the case of heating.
Load?curves?in?on?28?Jul?2025?after?solar?offensive
Left side: Load profile for the city power plants
Middle: Electricity load curve for one example district
Right: Heating load curve for one example district
In addition to the solar offensive, the exemplary Master Plan also outlines an annual rate of building refurbishment of up to 3% until 2020. This refurbishment would lead to an average heating demand reduction of 50% in the affected buildings. This rate does not apply evenly to all the districts but should focus on those areas, where the measure is most effective. It might for example not be useful to concentrate on districts which are supplied by district heating, as this technology is limited in its spread and is comparably sustainable. Important factors for the choice of location for refurbishment are the costs, the heat supplying technology and the number of buildings under monument protection.
Conclusions and outlook
A model using Anylogic and GIS is developed to analyze urban energy systems and their transition into the future. Outlined in Master Plans, this transition aims at a time horizon of 15 -30 years and envisions a sustainable, decentralized and cost-effective energy supply for the city. With different spatial granularity, i.e. partitioning of the city into many small districts, the model enables its user to set geographically specific parameters and to retrieve detailed output diagrams for every single district, with exact building allocation. Finally, the district energy demand is aggregated on a city level, thus continuously determining the operation grade of the city’s power plants.
As the composition of energy carriers for the heating supply of the different districts varies at a high degree, the city planners should individualize their energy Master Plan for every district, in order to reach the intended effect. At the same time a flattening of the power plant load curve on city level has to be reached, for example by increasing local energy production in the districts during energy demand peak times.
All the measures from the Master Plan outlining the urban energy transition can be implemented and simulated in the model. Two examples of an implementation of a solar offensive and a high annual rate of building refurbishment are outlined in this paper, which partly led to an overproduction of heat in one of the districts. By implementing more measures to the model it is possible to analyze feedback effects and interactions between the single measures, both positively as synergy effects and negatively as competition effects.
Outlook
On the whole, the model sets a solid basis for detailed analysis of urban energy systems; still it could be extended to other sectors and thus be adapted to the individual needs of the city planners.
So far the model only covers the buildings and their energy needs. Many Master Plans also include the mobility sector, which will in the long run also interact with the electricity grid through the electric vehicles and therefore create both additional demand and decentralized storage.
Furthermore, the spatial granularity for the partitioning of the city into the districts can be chosen freely by the user, theoretically even down to building level. Through this flexibility, the model can be scaled to the user’s preferences and adapted to overall goal of analysis. Therefore, this model can be applied by city planners to quantitatively assess the effects of their political measures.