Introduction
Synchronization effects, such as firefly lightning, describes such systems in which a large number of individual behaviours provide the system with different properties, going from disorder (asynchronous, random lighting) up to an almost perfect synchronization.
Classical approaches to technical systems try to avoid edge of chaos, due to its unpredictability. Engineers prefer to take over control of those systems by reducing their complexity to ordered states (classical mechanics) or controlled chaotic (combustion). But some systems in nature, especially those biological or social, where evolution is needed, get better results by being at the edge-of-chaos. Being at the edge of chaos can follow to continuously changing states of the system or to apparent stability that can be changed abruptly (criticality). This criticality, often observed in self-organizing systems, was first described in 1 through models like the sand pile.
In smart grid systems, and other socio-technological systems, criticality hasn’t been a subject of research, as the boundaries of the systems avoided edge of chaos states. But the introduction of behavior and bottom up decision making on classical electromechanical systems, can bring those systems, under specific conditions, to be under criticality. The complexity of those models combining successfully technical and social components make difficult to approach analytical methods. An empirical approach can be more helpful to understand under which conditions a system can change of phase space.
Simplicity,?chaos?and?complexity
In socio-technical systems, the conditions can be inherent to the physical phenomena underlying the system (frequency laws, power transmission laws), related to technical specifications (switches or connections), related to socio-economical considerations (behavior) or to the external conditions (external temperature).
In this study, the critical points of some systems are approached empirically. To understand complex phenomena, it is not always possible or efficient to do it analytically, as this can be impossible or largely complicated. Empirical research allows to explore space of solutions and the sets of parameters leading to different phase spaces or regimes, understanding under which conditions phase transitions are to be expected or which are the requisites of a system to stay at the edge of chaos.
Phase shifts and criticality
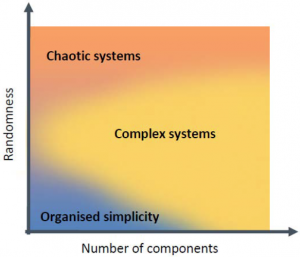
One of the most peculiar properties of complex systems is their situation between order and randomness, stable and unstable states. The term edge of chaos was introduced by Langton2 while analyzing phase transitions on cellular automata describes a critical point which separates order from disorder. This edge of chaos can be seen as a regime itself, in which complex phenomena take place3.
The aspect of phase changes can be shown in complex networks by the Watts-Strogatz model4. We start with an ordered ring lattice graph in which we rewire edges randomly. The average path length drops quickly after an initial limited rewiring, while the clustering coefficient remains almost constant, leading to a typical small world network. If we continue rewiring more and more edges, a random graph will emerge - a complete disordered system. Here we see that the average path length is still low, but has not decreased much since our small world state. It is noteworthy that the clustering coefficient dropped - another characteristic of a disordered system.
Complexity thus resides between an ordered network and a completely random topology. Here, the characteristics of both order and disorder meet and complex effects can be observed, such as changing and emergent patterns. This example illustrates the location of complex systems and phenomena situated between ordered systems and randomness. Langton2 introduced the border where a system gets chaotic, while analysing phase transitions on cellular automata. A cellular automata is governed by simple rules, but have proven to show highly complex behavior.
This term refers to a critical point which separates order from disorder, and plays an important role in complex system theory. Some natural systems are pushed versus the edge, which can be seen as an driver for evolution. Complex phenomena can take place there, which allow the system to change its state, which unlikely to happen in a completely ordered or chaotic environment (evolutive landscapes, red queen theorem).
In order to maintain “fitness” in a changing environment, it will be necessary for the system to be capable of actively transforming itself over time5. Here resides the importance of the edge, in evolving environments, the system has to be adapting continuously in order to stay in efficient conditions and these adaptations and changes are more likely to happen at the edge.
An example of this edge, which is familiar to the engineering and technical domains, is the Reynolds number. It is used in fluid mechanics to characterize different flow regimes, such as laminar or turbulent flow. A laminar flow occurs at low Reynolds numbers, where viscous forces are dominant, and is characterized by smooth, constant fluid motion; turbulent flow occurs at high Reynolds numbers and is dominated by inertial forces, which tend to produce chaotic eddies, vortices and other flow instabilities.
Simulation study for socio-technical systems
Socio-technical systems are present in the real world everywhere in which a technical system interacts with human behavior. This is the case for the major part of existing technical systems. In order to model the ”whole” behavior, human behavior has to be added to technical models. Coupling social with technical models is therefore a requirement for modelling large, complex systems. Agents are well suited to this approach, as by definition, they include behavior which can be interpreted as a social for also technical behavior.
As an example of this, urban water systems were modeled as complex adaptive systems by using agent-based modelling6. The approach allowed for a support of analysis of the system, by acquiring a fundamental understanding of the processes, e.g. emergent phenomena, relating to water safety and human behavior, which could be represented through a micro-modelling rather than being described as a probabilistic causal model at the macro level. So, it was noted that while steady-state behavior was achieved in most cases, occasionally very different steady-states occur, and sometimes they also had sudden shifts that occur for diverse and unexpected reasons6. Being a non-deterministic model, it allows however, given a set of conditions, to predict in a certain way the patterns of system behavior, at least in a probabilistic sense.
Electrical energy systems as complex systems
The energy system is a highly interconnected system of systems7, which is undergoing a paradigm shift moving away from a centralized and hierarchical structure, towards a new system where more distributed actors have an influence on it.
Electrical energy systems are composed of different networks and levels, usually differentiated by their voltage. Large producers inject at high voltage levels, medium voltage level is used for distribution and mid-size production units, as well as industrial consumers, and the low voltage level delivers electricity to the final consumers. All these levels are interconnected through transforming stations. Electrical grids are usually large scale systems, ranging over vast geographical areas, such as the European or North American power grid. The system itself is in continuous change, offering a highly dynamic behavior in time and space. Transitions emerge over time as fundamental change of large-scale socio-technical systems (lambda-systems) such as energy infrastructures that are the backbone of society8.
The paradigm shift the system is going through at the time being involves that production is no longer limited to large energy providers. This is due to the entrances of small decentralized producers in the form of distributed generation to the network, which are able to inject energy at much lower voltage levels than before. This permits that energy can be consumed close to where it is consumed, avoiding long transmission paths. However, a tendency towards a less hierarchical system can be observed, which even involvers energy flows that become bidirectional (not only in direction of the lower levels, but also going up sometimes). This involves technical and regulatory challenges which have to be taken into account in the current developments. A better knowledge of the demand side is needed in order to tackle these points.
The electrical energy system thus can be seen as a system-of-systems with a high increase of decentralized decision processes. Also, new technologies increase the means of communications and the interactions along the network. A large number of entities, with growing heterogeneity, characterize the system as a complex one.
Current tools are usually only focusing on one scale or level. So, behaviors on different levels are hardly being represented together, or interacting across scales. However, this is needed to understand the causes and effects across a complex system.
Few applications of complexity theory on electrical energy networks can be found so far in literature. Particularly, the fragility of the high voltage system in different country toward targeted attacks, using complex networks theory was analyzed9. The authors found a correlation between topology and the dynamics of the system. Other applications can be found in energy markets, where complex modelling approaches such as agent-based modelling (ABM) are used to reflect market behavior by heterogeneous actors.
Cascading events in the power grid have led to major blackouts in the past. These cascading failures are related to de-synchronization processes in the electrical system. Being composed of production, dissipation, transmission, and consumption, the electrical system represents a dynamical problem and the power grid can be seen as an example of a system of oscillators10.
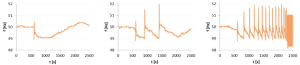
Previous works in the smart grid domain have shown that there can be phase shifts in these systems. In 11, a refrigerator demand side management simulation has shown to oscillate largely, which would imply catastrophic consequences on a real system. Whereas refrigerators work based on pulsating loads, these loads are usually not synchronized. By intervening the system though smart grid measures though, in some cases the phases of the loads can coincide, leading to such a synchronization in which the system begins to oscillate. Through empirical tests using a simulation model, these stable, partially stable and unstable regimes were analyzed.
Synthetic presentation of the case study
The case study we chose here is based on the works described in 11,12. A simulation model of a domestic refrigerator (micro-level) was coupled with a simplified model of an electrical energy system (macro-level). The idea behind was testing autonomous load shedding strategies for refrigerating appliances. By using a global indicator from the electrical system, the a device at individual refrigerator level decides locally whether to stop consumption, to support the reserve mechanisms of the power grid and increase the stability of the system. This mechanism seemed to work well to stabilize the system after major events like the breakdown of a production unit. However, the studies also detected that, under certain circumstances, when increasing the number of controlled refrigerators, non-desired, dangerous effects like oscillations could occur. The model allowed for a first analysis by probabilistically quantifying the risk of such an event. Furthermore, besides the stable and the oscillating state, an intermediate regime was found in which it is uncertain if the system will fall towards stability or instability (Figure 2).
Stable?(left),?partially?oscillating?(center)?and?oscillating?(right)?regimes
In this paper, we decided to go further and analyze the critical zone in a more detailed manner, taking into account:
an increase of the simulation entities to analyze these effects on massively replicated agents,
obtain a better understanding of the synchronization and de-synchronization processes
perform a parameter analysis to detect which factors have an impact on these effects
Also, we analyze which conditions move the system towards a critical space. These steps are described in the following:
Simulation in a high performance environment
To do so, the simulation model is transposed into a suitable simulation framework. So far, simulations were run in Anylogic. In this case, the model is implemented in Tafat 13, which allows for better performing simulations and a larger number of agents running massively in parallel. For these simulations, we obtained a factor 4 of improvement in the execution time. Furthermore, Tafat was adapted in this case to perform parameter variations.
The goal of the Tafat framework is to make easier and faster the development of agent and object-based simulations. The use of Tafat allows representing a scenario using a bottom-up approach where the global behavior emerges from the aggregation of the behaviors at lower levels. This approach allows studying the electrical grid as a complex system where the emergent behaviors can exhibit unexpected and unknown concerns. Those concerns can be explained by the study of the individual behaviors and the elements interaction. In this paper, we use Tafat since it allows representing the device level where the distributed measures act. Using Tafat the effects caused by those measures can be retrieved at different scales as the containment hierarchy can be represented.
From a conceptual point of view, Tafat is conceived using a Model-Based Engineering Paradigm and its architecture is divided in three main components: meta-model, repository and model. The meta-model defines the simulation elements to be used in the models. The repository contains the behaviors which represent the way in which the elements at the metamodel work. Finally, the model is the representation of the simulation scenario, that is, the instantiation of the meta-model elements that represents the scenario and their behaviors (from the repository). The simulation elements are divided in three kinds: entities, connections and agents. In Tafat a simulation life-cycle is recommended which reaches the advantages of this framework. The life-cycle consists of four steps: data preparation, model creation, model simulation and result analysis.
Simulation results and discussion
The different factors that have an impact on the system can be classified into the following categories. We have classified the different factors of impact on the system into
External: related to the environment, around the system (production, failure, etc.)
System relevant: related to the system that we are contemplating (Number of fridges, proportion of fridges towards the system)
Entity internal: related to the individuals composing the system (Number of controlled fridges, parameter of individual entities of the system, door openings)
For the latter, the impact on the global system is difficult to evaluate without a complex modelling approach. Even if controlling the external and system variables, the system remains unstable, simulation can help us to determine whether if changing the internal condition can have an impact on the
This is a typical emergent phenomenon as we have individual behaviors (conditioned by internal parameters) which can have an impact at aggregate level.
In Table 1, the main simulation parameters used are presented.
Table?1
Parameters and their classification
The parameters of the model can be classified using these categories. All of these can be controllable or non-controllable. So, for example, the threshold setting of the load shedding algorithm and the door opening rate are both internal, but the first one is controllable and the latter not (it depends on social behavior which is only likely to be influenced indirectly).
Not controllable parameters should be simulated as well, even if they cannot be modified in the real system. However they give an idea how a singular factor affects the system, and if this factor changes (external conditions), we can know the effect on the system.
Furthermore, we can classify the parameters as fixed or varying. When we call them fixed, they are usually similar for all the entities of the system. Random or varying parameters describe variations on the characteristics among entities of the same types. So, the refrigerators can have different installed powers according to a distribution, which is taken from survey data.
In the first case, we analyze the phase space of the system. As said, given the described load shedding algorithm in 11, the system can remain in three states:
We try to avoid the oscillating state and any risks of partial oscillation, as the can lead to catastrophic oscillations between frequency and loads on the system, which would cause an immediate blackout or damage to the system.
Metrics are used to detect different phases of the system. A metric has to be adapted to the effect to be studied, in this case the particular to a problem of detecting oscillations. These are detected by counting the number of simulation steps in which the grid frequency undergoes a threshold value, and clustering these results, to obtain the three regimes:
stable (only one under passing at the production breakdown)
partially stable (some oscillations, less than 20, but stabilization after)
oscillating state (many oscillations, more than 20 but usually several hundred until the end of the simulation).
As we are dealing with non-deterministic simulations, an identical configuration of the simulation can lead to completely different results. So, a Monte Carlo experiment with 100 runs per configuration set was done. For each configuration set, the probability of being in a determined regime was calculated.
In a first stage, the external parameters, such as proportion of refrigerator loads vs. the total system load were adjusted (refriShare). Further, a scale factor was used, as although tested, for massive Montecarlo simulations (several thousands), simulating 400.000 refrigerators was not feasible. Before, it was shown that an aggregated behavior was already achieved with 2000-5000 refrigerators.
Scenario 1: Variation of the share of controlled refrigerators
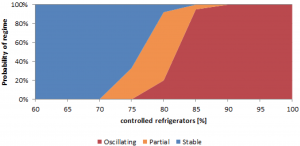
Once found a state where the system is between order and disorder, the proportion of controlled refrigerators was increased in steps of 10%. We found that the system remained completely stable below 60%. Therefore, focused on the interval 60-100% where the partial regime, the state which represents the edge of chaos, is located. The proportion was here varied in steps of 5% to have a higher precision.
Stability?of?the?system?vs.?controlled?refrigerator?share
In Figure 3, we can see a phase shift in which the partial regime represents the edge of chaos. At this stage, with fixed conditions of the system, it is not predictable whether the system will oscillate or remain stable. Through the simulation analysis however, a probability of this occurring could be calculated based on an exemplary case. In this case, we see that the variation of a system parameter can have an effect on its stability, and using the described method for a concrete system, a maximum value for integration of a certain technology could be obtained, assuring that the system will be always far from the critical zones.
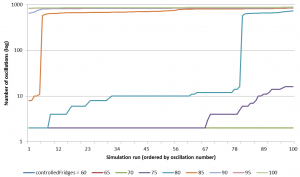
Ordered?plot?of?100?simulation?runs?for?different?shares?of?controlled?refrigerator
Figure 4 shows the number of oscillation for the different shares, ordered sequentially. We see the steps in the curve which represent stable systems (2 oscillations), partial (some oscillations between and oscillating regimes (several hundred).
Scenario 2: Variation of door opening rate
In this case, we wanted to test the effect of an internal parameter, which is not controllable. We chose the door opening rate, as it is a characteristic variable for a socio-technical systems, in which human behavior gets into interaction with a technical system. Even if it cannot be controlled, door opening is likely to vary due to external factors, which can be predicted in some cases. This means, that without controlling the variable, we can nevertheless know how a system will react to it, if the external conditions are changing. For example, door opening can be increased due to extreme events, such as the World Cup final or the Superbowl, where a large amount of people may synchronize their behavior.
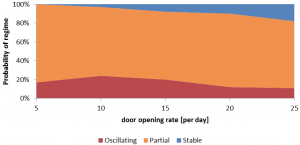
In this case, we fixed the controlled refrigerator share at 80%, which in the previous experiment showed to be at the edge of chaos. Now, the average door opening rate per day was changed and plotted in a similar manner.
Stability?of?the?system?vs.?door?opening?rate,?for?fixed?controlled?refrigerator?share?at?80%
We can see (Figure 5) that the door opening has no clear effect on shifting the edge, even if a small tendency can be seen towards a slightly more stable system when there are more door openings. The uncertainty of the partial regime is marked by a high probability (around 70-80% in all cases). Due to the probabilistic nature of the model, a larger number of simulations should be done to analyze it further. In the given range, no significant impact on the stability can be observed.
Scenario 3: Variation of the controlled share and frequency threshold
In this case, we are varying two parameters at the same time, to see if the threshold frequency at which the load shedding is activated has an impact on stability, and if it is dependent on the controlled refrigerator share. This simulation was run with the same parameters as above, running again a Montecarlo experiment by doing 100 runs for each configuration setting. In this case, we have a large amount of simulations as 8 × 9 parameters were varied, which results in a total of 7.200 simulation runs in the Montecarlo mode. The simulation was run for 2.000 refrigerators with an adapted scale factor.
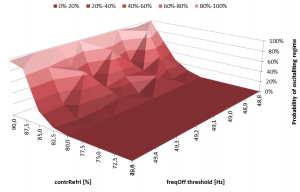
As we see in Figure 6, as expected with higher shares of controlled refrigerators there is a higher risk of oscillations. However, a clear impact of the disconnection frequency threshold (freqOff) cannot be recognized. A slight tendency in which at lower thresholds (< 49Hz) the oscillations occur at earlier stages, might appear, but should be analyzed with more extensive Montecarlo runs.
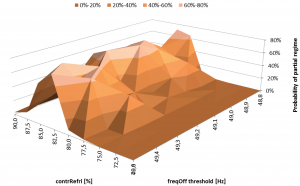
For the partial regime (Figure 7) a similar conclusion as in scenario 1 can be made. At around 85% of controlled refrigerators, this regime is most likely to happen. Below and above, the probability is lower as the system is either stable, or oscillating.
Probability?of?being?in?the?oscillating?regime,?in?function?of?contrRefri?and?freqOff
Probability?of?being?in?the?partial?regime,?in?function?of?contrRefri?and?freqOff,?which?represent?the?phase?space?at?the?edge?of?chaos
Conclusions
Socio-technical systems are in constant evolution, which makes them dynamic in time and structure. This has been made clear through an example in the energy system. Using distributed smart grid measures which are supposed to improve grid stability, oscillating problems were detected, as the system is driven towards the edge of chaos. This criticality has been analyzed empirically through simulation by using a complexity based modelling approach.
The case study shows that a border can exist, the edge, at which in only some cases critical situations occur. This border can be explored through massive simulation, allowing for evaluation of different situations and a statistical analysis of the massive simulations (Montecarlo).
For an exemplary case, the penetration rate of a demand side management device was varied, observing the amount of times that the system enters a stable, partially stable or oscillating regime. this allows for quantification at which penetration rates systems remain in a safe state, and allow to identify at which point critical situations can occur. these situations occur as a phase shift, but the edge as has been shown can have a range at which only in some cases critical situations are caused. through massive simulation these cases were found and quantified.
Furthermore, different parameter were varied to analyze if they have an effect, pushing the system towards the stable or chaotic sides. It has been shown that some parameters have no effects (door opening), and other have low effects (threshold variation). Further simulations are outstanding.
Simulation, and especially massive simulation on a bottom-based approach has proven to provide a valuable tool to analyze and explore the behavior of complex socio-technical systems, such as the electrical grid, allowing to show both engineering and complexity science aspects in the same model. These means allow to quantify risk in a given situation, determine cause-effect chains through a detailed observation of the systems trajectory in particular cases.
Simulation is though considered as a mean to empirically explore the edge of chaos, based on a real socio-technical system which itself would be too risky to take the experiments on.