Introduction
The concept of patterns is used primarily in the study of complexity (Waldrop, 1992; Gell-Mann, 1995; Capra, 1996) and complex phenomena like organizations (Perrow, 1986; Rogers et al., 2005; Glor, 2007a). Some authors have suggested that nothing is predictable about organizational patterns (Falconer, 2002), while others would see it as possible (Glor, 2001a, b; 2007a, b). Falconer (2002), for example, suggested that (1) Change is not managed, (2) Change is not linear, (3) Change is not formalizable, and (4) Change is not discrete. He held that “It is probably better to consider the epiphanies of change as singularities, as the appearance of highly unstable states of order that are then as quickly lost” (Falconer, 2002: 126). He recommended a “frame of complexity, openness, continuousness, and emergence” that can be encapsulated in the concept of patterns, adding:
Pattern describes a knowledge metaphor, which encompasses instantiated artifacts, that is as closely analogous as practicable to the thought patterns envisaged as tacit mental metaphors… A business pattern essentially lays out a metaphorical device for the capture and reuse of explicit organizational knowledge.
Falconer, 2002: 127
Having defined a pattern as a way of thinking, he went on, however, to describe it as being “in the domain of circumstances and behavior that characterizes and defines a general business milieu” (emphasis added, Falconer, 2002: 127). This elevated consideration several conceptual levels by referring to a pattern in a population, namely, businesses.
Falconer recommended “using patterns as the operational metaphor for observing, understanding, and expressing [organizational] change, and using the pattern language that would emerge both as the representation of the inherent meaning of the change under consideration and, conceptually, as the environment in/with which it interacts” (2002: 128). He indicated that “This solution would exhibit the following characteristics: (1) Open, holistic, continuous, nonlinear, flexible, and adaptable; (2) Having no implication of “management,” structuredness, prescription, or methodology; (3) Not able to be modeled or described in its essence; and (4) Driven by emergent phenomena within the change landscape” (Falconer, 2002: 128-129). While Falconer sees organizations as changing in patterns, his approach to organizational change patterns would not permit much to be said about how patterns change.
Kauffman (1995: chapter 4), on the other hand, found patterns in change. He explained biological evolution, a complex phenomenon, as having two sources of order, not just the one that Charles Darwin identified. Darwin saw genes as the source of order and genetic evolution as the source of change in biological systems. Kauffman explained that genes emerged as a means of creating order in higher order living beings but that the development of genes, and their guiding relationship with living things, is a highly improbable development. Moreover, genes emerged well after life evolved on Earth. An earlier source of order is needed to explain the emergence and early evolution of life. He identified spontaneous (emergent or autocatalytic) order as this other form. It emerges without intervention, “for free,” in sufficiently complex environments with limits. He found that “astonishingly simple rules, or constraints, suffice to ensure that unexpected and profound dynamical order emerges spontaneously” (Kauffman, 1995: 74). Kauffman confirmed this natural emergence of order both analytically and through agent-based modelling. The natural tendency of phenomena involving living beings, including organizations, is to grow more complex; Kauffman demonstrated that order will emerge in such environments. Kauffman also showed that autocatalytic evolution is more likely in more complex environments and less likely in less complex environments. Evolution requires heritable variations; evolution is therefore supported by heterogeneity.
Rogers et al. (2005: 20) supported Ross Ashby's (1956) notion of a law of requisite variety which “posits that system variation needs to match the corresponding features of environmental demands if organization and collective action are to be effective” (Rogers et al., 2005: 20). In other words, both Kauffman (1995) and Rogers et al. suggested that evolution requires variation, the capacity for self-organized emergence and selection. Organizations exhibit all of these characteristics: Glor (2007a, b) explored these three elements in organizations.
Like Falconer, Glor saw patterns as complex, open, continuous, and emergent, but she also saw them as ways of functioning that organizations and organizational populations tend typically to assume, as individual motivation, management style/organizational culture and the challenge of implementation interact and as the organization interacts with its environment. “Each interaction is unique, yet the interactions tend to form into patterns, perhaps in a manner conceptually similar to those produced by chaos theory” (Glor, 2001a). Glor agreed with Bandura that the inclination to adopt innovations (a form of change) should be considered "in terms of controlling conditions rather than in terms of types of people" (Bandura, 1977: 54). Glor found these elements formed eight organizational change patterns. This inclination toward patterns of organizational behavior has an important impact on both organizational and organizational population behavior and change. Seeing patterns this way might allow some room for making statements about the evolution of organizational and organizational population innovation and change patterns.
This paper explores and links five issues related to the process of change (not the content) (Barnett and Carroll, 1995) in organizations and organizational patterns: (1) Why do organizations change little/considerably? (2) What are the patterns of organizational change? (3) Why do organizational patterns change/not change? (4) If patterns change, how might they change? What dynamics could be at work? (5) How much would they change? Are organizational patterns likely (eventually) to evolve into different patterns? If the answer is “yes,” can we say anything about which patterns would change and which patterns they are likely to evolve into? This might help illuminate whether organizational change patterns can be expected to survive or whether some of them should be seen as short-term, transitional states.
The discussion considers changes in organizational populations and their patterns more than change in individual organizations. It takes a broad look at the patterns of change in organizational populations. Organizational populations are such things as an industry, all the newspapers in a country, all the members of a non-profit sector that includes a population, and individual governments. Built on Kauffman's (1995) identification of the patterns of evolution of complex systems, the paper employs the eight self-organized patterns of functioning of organizations and populations that Glor identified (2001a, b) and her methods for studying them.
Using Glor's scores for the complexity of the patterns (Glor, 2007b), the eight organizational population change patterns are examined to see what changes in the scores would be required for the patterns to change and whether the patterns can be distinguished in terms of their comparative likelihood and rate of change. If they can be distinguished, something can be said about which patterns are more likely to change and which are likely to change faster. The analysis has five aspects. The starting point is an examination of the direction in which change is likely to occur, followed by consideration of the magnitude of change required to change to another pattern, and finally basins of attraction, likely incidence of change, and the speed at which patterns are likely to change. A new analysis considers where the patterns sit within their pattern complexity score ranges—close to or far from other patterns: The eight patterns' scores can exist in three ranges—close to the next less complex pattern; or in the middle of the range, where considerable change is required to change patterns; or near the next most complex pattern. This describes the magnitude of change required to change a pattern. As Kauffman indicated, change is more likely in the more complex areas of the ranges. At the same time, there is also order in patterns. Because Glor's patterns describe organizational populations that are changing, it is self-evident that they are capable of at least some change. People may be able to intervene in organizational patterns to reduce change and complexity but constraint is also needed to produce evolution (Kauffman, 1995). The results of the analysis are then used to judge the overall effect of the several forces at work, to follow how the organizational change patterns would likely evolve, and to develop probabilistic hypotheses about how they would likely evolve.
Issues
Issue 1: Why do organizations change little/change considerably?
A model of organizational population evolution needs to account for both inertia and change in organizations and organizational populations. There is literature on both topics.
Why do organizations stay the same?
This question is addressed in the institutional (isomorphism), complexity, organizational ecology and complexity literatures. The institutional (e.g., Selznick, 1957; Perrow, 1986) and neo-institutional literature, with its link to structural-functionalism (e.g., DiMaggio & Powell, 1983; Powell & DiMaggio, 1991; Frumkin & Galaskiewicz, 2004; Peters, 2005; Pursey, Heugens & Lander, 2009) provide insight into organizational and population inertia. While this literature does not deny any change, the main explanations for lack of change identified are the stability of organizational arrangements, institutionalization and institutional pressures toward the same organizational form, and the organizational practice of isomorphism. Isomorphism involves imitation and the tendency to create homogeneity with other organizations in the organizational community[2] and the organizational population (Greenwood and Hinings, 1996: 1023-25). Greenwood and Hinings emphasized two major factors in organizational resistance to change: first, their normative embeddedness within their institutional context, and second, structures of the institutional sectors (1996: 1023). While this may require an initial change toward homogeneity, once this change is achieved, according to the institutional literature, organizations are not likely to change further in major (strategic) ways unless the population itself changes again (Peters, 2005). This tendency towards isomorphism among organizations has been shown to have positive implications by improving organizational legitimacy and reputation, and hence access to resources (Deephouse, 1996; Frumkin & Galaskiewicz, 2004; Pursey, Heugens & Lander, 2009). Isomorphism is probably a major factor in organizational constancy, and the emergence of organizational and organizational population patterns of the fixed/frozen (“fixed” will be used for conciseness) type. Fixed/frozen is a term used by Kauffman (1995) and is discussed later.
The concept of isomorphism explains initial change followed by inertia. Isomorphism is a particular change by many organizations in a population. As a group the organizations then become fixed, with less change. Kauffman (1995: chapter 4), a complexity theorist, found that among three patterns of change, the fixed organizational pattern converges. Thus, both (neo) institutionalists and complexity theorists see some complex phenomena/organizations converging and growing more alike. The patterns presumably also decline in complexity, relative to their environments. Once changed, the pattern of these populations (and organizations) is likely either to remain constant or to decrease in complexity. At the same time, isomorphism is known to enhance organizational survival due to the legitimacy it attracts (Deephouse, 1996; Pursey, Heugens & Lander, 2009). Burke also saw patterns, which he called deep structures, as rarely changing (2002: 59).
Organizational ecologists (Hannan, 1988; Hannan & Freeman, 1984; Hannan, Polos & Carroll, 2004) support this idea:
(M)ajor innovations in organizational strategy and structure occur early in the life histories of individual organizations and of organizational populations…change in core features of organizational populations is more Darwinian than Lamarckian[2]…inertial pressures prevent most organizations from radically changing strategies and structures. Only the most concrete features of technique can be easily copied and inserted into ongoing organizations.
Hannan, 1988: 98
Structural inertia theory, a subset of organizational ecology (Hannan & Freeman, 1977, 1984; Baum, 1996), holds that organizations have trouble changing fast enough to keep up with their environments. Because major innovations tend to occur early in the life of organizations and populations, organizations are seen as relatively inert and inflexible. Hannan et al. suggest that architectural inertia has evolutionary consequences. Because selection favors architectural inertia in organizational populations, the median level of inertia increases over time in a closed population. This selection intensity increases in keeping with increases in the level “of intricacy and structural opacity and decreases with cultural asperity” (2004: 213). All of these theories—(neo)institutionalism, organizational adaptation, organizational ecology, and structural inertia—see organizations as not changing much.
Why do organizations change?
What causes individual organizations to change has also been of considerable interest. The literature has suggested change can be evolutionary or revolutionary adaptation (both responsive and proactive) (Greenwood & Hinings, 1996; Burke, 2002), can occur through organizational survival and death (organizational ecologists), and can be self-organized due to complexity (Rogers et al., 2005). The neo-institutionalists see both the incidence and the pace of change as varying within sectors due to differences in internal organizational dynamics in interplay with the organizational context. The context is seen as primarily a function of the organization's normative embeddedness in its context and the organizational dynamics as primarily due to the political dynamics of intra-organizational behavior (Greenwood and Hines, 1996: 1023-24). The organizational adaptation literature suggests changes occur in response to such factors as crises, culture, leadership and changes in resource availability—such changes are seen as being due to individual and social will. The large organizational adaptation literature promotes change and innovation in organizations and suggests how this might be accomplished. This literature tends to support specific approaches, whether bureaucracy, business process engineering, or the New Public Management and privatization of public services. The impacts of such approaches have not been pursued much, however, especially at the organizational population level.
The organizational evolutionists/ecologists illuminate organizational founding, change, survival and mortality (the highest level of organizational pattern), but also community ecology, and (at an even higher logical level) organizational population and sector patterns. Sectors are considered to be the private, non-profit and public sectors (e.g., Baum, 1996). According to the organizational evolutionists, change and variability occur primarily through organizations dying and being replaced by new organizations in the population. This is similar to Darwinian evolution, where change occurs primarily inter-generationally. Other organizational observers take a more Lamarckian evolution approach, focusing on variability within organizations and populations as a source of pattern change (Rogers et al., 2005; Glor, 2007a, b). Still other authors build on fitness-set theory (Levins, 1968), focusing on the environment as a source of variability, both in terms of the variance of environmental fluctuations and variations in grain. Grain can be fine (many small, periodic variations) or coarse (a few large, periodic variations) (Hannan & Freeman, 1977).
Kauffman (1995) suggests that change evolves naturally, without will, out of complexity and restraint, in all systems. He does not indicate resources are necessary for this change to occur. Complex biological organisms and ecologies evolve naturally to even more complex forms (Kauffman, 1995) and co-evolve with their environments. As they evolve, complex phenomena self-organize into patterns, order for free (Kauffman, 1995, chapter 4). Like all complex phenomena, organizations are inclined to evolve continually toward greater complexity. In complex systems the parts interact with each other and change emerges from this interaction. As long as organizations retain complexity, they have the capacity to evolve. Kauffman sees lack of complexity leading to less change and variety and more complex systems as having more capacity to evolve than simpler ones.
Kauffman (1995: 86-92) identified three possible types of complex system (networks): fixed/frozen, edge of chaos, and chaos. A fixed system is orderly. It has stability but lacks flexibility. It is therefore less likely to change than more complex systems. A system at edge of chaos (EOC) is maintaining both stability and flexibility. It is in phase transition and generates surprises. At the EOC the most complex behaviors can occur. A system in chaos lacks stability but has enormous flexibility. Patterns change because they are drawn to state cycles/basins of attraction. The effect of basins on organizational population pattern change is discussed later in this paper. Some types of systems are much more sensitive to initial conditions than others: Ordered systems are insensitive to initial conditions, while chaotic systems are sensitive to them (Kauffman, 1995: chapter 4).
Even though the natural tendency is for organizations to become more complex over time, human volition can intervene—it can reduce the complexity of organizations (e.g., through reorganizations and reductions in resources), enforce isomorphism, and organize complexity into patterns. This occurs, for example, through leadership, priority-setting, strategic planning, budgeting systems, human resource systems, reorganizations, and auditing and accountability. Moreover, organizations and organizational populations that change increase their risk of mortality. Once an organization has changed, it is more likely to change again than organizations that do not change (e.g., Singh, House, & Tucker, 1986a).
A response to the first issue, why do organizations change little/considerably might be, then, that: (1) some organizations and organizational populations do not change much, due to isomorphism, structural inertia, and low or decreased complexity; and (2) organizations and organizational populations have a higher likelihood of change if they are highly complex and if they have already changed.
Issue 2: What are the patterns of organizational change?
A number of researchers considered this question, often addressing only two ends of one continuum e.g., evolutionary and revolutionary change (e.g., Tushman & Romanelli, 1990). This paper explores patterns through Glor's eight complex organizational and organizational population patterns. She identifies three complex organizational dynamics (factors)—individual motivation, organizational culture, and magnitude of challenge, interacting to yield the eight organizational innovation or change patterns (Glor, 2001a, b). Working initially from the perspective of innovations, she identified the patterns by considering each multifaceted factor to have two poles. The produces eight patterns-- imposed, reactive, active, buy-in, proactive, necessary, transformational and continuous innovation/change. In the imposed innovation pattern, for example, innovation occurs in an environment of extrinsic individual motivation, a top-down social environment (including management style), and a major challenge to accomplish the innovation. In the proactive pattern, on the other hand, innovation occurs in a pattern of intrinsic motivation, a bottom-up social environment and a minor challenge. The eight patterns can be applied to all or maybe most organizations and populations, not just innovative ones, and are useful in exploring change in organizations and organizational patterns. If organizational patterns do change into other patterns, this would suggest that Glor's eight patterns might evolve into each other and possibly into more or fewer patterns over time. In his agent-based modelling of complex systems, Kauffman (1995) found that eight systems eventually evolve into three. This possibility is discussed for Glor's patterns later in the paper.
Issue 3: What causes organizational patterns to change? Is it likely?
Organizational population patterns can be seen as changing by changing their complexity. According to complexity theory, less complex organizations have less capacity for change and evolution, while more complex organizations have more capacity for change and evolve faster (Kauffman, 1995; Rogers, et al., 2005; Glor 2001b, 2007a, b). An understanding of what causes organizational patterns to change thus requires an analysis of the complexity of the organizational patterns. Glor (2007b) analyzed the complexity of the eight innovation patterns and calculated a complexity score for each one (partially reproduced in Table 1).
An understanding of what causes organizational patterns to change also requires an understanding of when, which, and how patterns change. Based upon agent-based modelling, Kauffman (1995) found that complex systems grow continually more complex. In living systems, this is not as likely since growth in complexity usually requires resources. Human intervention in some natural systems for example has made them less complex. Consider the effects of mono-agriculture and chemical use on soil: The soil loses many of its living organisms and thus complexity. Likewise, some completely fished-out or low-oxygen areas (due to hyper-algal growth) in the oceans now support fewer species of complex life (jellyfish). These are examples of complex ecologies being converted into simpler systems due to human intervention. In becoming simpler, they have lost much of their capacity for change to emerge. This is also probably true of organizations. Examples of organizations becoming simpler are those going through downsizing—they are losing resources, becoming simpler, and responding to fewer elements in the environment. Likewise, at least some organizations moving into isomorphic structures become simpler. Consider when governments introduced the New Public Management (NPM). They privatized substantial portions of government and retained only portions of their original functions as they sought to “steer, not row”.
Table?1:?Organizational?pattern?complexity?and?direction?of?movement
Sources: Kauffman, 1995; Glor, 2001b; 2007a, b.
Notes:
For the most part, environments evolve to become more complex over time but human effects can reduce the complexity of environments. Human efforts are often also expended to see and present issues as less complex than they really are—this is a primary purpose of communications in organizations. President Bush's War on Terror, for example, presented security as the primary issue in the environment, amenable to intervention through both traditional and expanded military and intelligence means, and the selection of priorities as a simple matter. Instead of controlling and reducing terrorism, the complexity of the (security) environment increased substantially as more individuals and organizations (including governments) entered the domain by adopting terror tactics. Did the approach unwittingly facilitate an increase in the complexity of the security issue? It probably did but the process led the US government into deep debt and later reduced resources for other programs (making them more simple) to pay for it. To take another example, President Obama began his attempts to secure action on gun control, by presenting the issue through communications—political speeches, simplified for news stories and stories of individuals, families and communities affected by mass murder with guns. While also relatively simple, stories have more potential to retain some of the complexity of reality. Politics is one of the ways in which environments are brought to bear on organizations.
Some environmental factors identified in the literature that can affect the complexity of organizations are outlined in Appendix 1. They relate to how internal unit environments, organizational ecologies, top-down control and population ecologies evolve within and in relation to their environments and affect organizational pattern change. For example, institutional rules and challenges create an environment that affects individual motivation, the organizational culture and how easy or difficult it is to deal with a challenge. Likewise, the history of changes in an ecology affects and contributes to the patterns of functioning and the stories told in an organization. They in turn affect the dynamics in an organizational population. Also, in a community ecology, density dependence (DD) affects the vital rates (founding and mortality) of organizations and therefore competition for limited resources. DD can either encourage organizational founding (if resources are plentiful) or mortalities (if resources are scarce).
A response to the third issue could be that organizational patterns change because of changes in complexity in organizations and environments.
Issue 4: If patterns change, what dynamics are likely to be at work?
Five possible dynamics affecting change are discussed: (1) direction of change, (2) magnitude (quantity) of change in complexity required to cross a Glor pattern boundary, (3) basins of attraction, (4) incidence of change, and (5) speed of change. Direction, magnitude and speed can be seen as push factors, for example, in a change of political ideology pushing employees in a new direction. Basins of attraction and incidence are pull factors, drawing the factors toward change of pattern.
In what direction will the organizational patterns move—toward less or more complexity, toward less or more change?
Using an evolutionary approach, organizations have been defined as goal-directed, boundary-maintaining, socially constructed systems of human activities (Aldrich & Ruef, 2006: 4). Because these three characteristics of organizations (and types of processes) interact with each other and each of the three characteristics involves a number of aspects that also interact with each other, organizations can be said to exhibit complex behavior in interaction with their environments. Complex factors interact with each other as well as affecting results simply and directly. To be fit and to respond effectively to its environment, an organization must be able to receive, recognize and act on information, allow change to emerge from complexity, and respond to its environment in a way that matches the environment's complexity through appropriate orders of change (Michaels, 2000).
Organizations that are allowed to evolve and have sufficient resources to do so will move in a more complex direction in step with their increasingly complex environment. If organizations are not allowed to evolve or have insufficient or even fewer resources to keep up with the environment, they will probably remain at the same level or even decline in complexity. Simple, less expensive solutions will be sought and isomorphism adopted.
More complex systems evolve quicker, so they can be expected to be more innovative and to change faster (Kauffman, 1995). Like other complex networks, organizational populations can be expected to evolve most effectively in Kauffman's EOC pattern and to evolve most and fastest in his pattern of chaos. The most adaptable or fit state is at the EOC, that is, neither in a fixed state nor in a state of chaos, but near a state of chaos. Kauffman hypothesized that complex adaptive systems (CAS) evolve to the EOC (Kauffman, 1995: 91). The implications of CAS are (a) less complex patterns are more likely to be homeostatic, and (b) more complex patterns are more likely to become chaotic or appear to be chaotic (have large cycles). Accordingly, the EOC and chaos are the conditions or patterns in which the most change or adaptation occurs. The change itself is more adaptive at the EOC and hence organizations and organizational populations are more fit than in chaos.
As mentioned earlier, Glor (2007a) developed a methodology for assessing the complexity and innovativeness of the eight organizational innovation patterns. She measured the variety, reactivity and capacity for emergence, the three characteristics of complexity identified by Rogers et al. (2005), of each of the eight organizational change patterns and developed a complexity score for each one. In keeping with Kauffman's approach, fixed and chaotic patterns were considered the least fit and organizational patterns at the EOC were considered the most fit (Glor, 2007b). Glor (2007b) went on to group the eight patterns into Kauffman's three patterns, and thereby to identify the direction of pattern movement, that is, whether the patterns were converging, neither converging nor diverging, or diverging. Greenwood and Hinings (1996: 1024; 1026) see convergent change as fine tuning within an existing archetypal template while other definitions emphasize convergence as approaching a limit or (in math) one point or approach (The Free Dictionary, 2013). Kauffman was likely thinking of the mathematical definition as he is trained in mathematics. Using this scoring process, each pattern's flexibility, stability, and direction of movement were identified, notions Kauffman explored in his modelling (1995: chapter 4).
A summary of Glor's pattern scores is presented in Table 1, columns 1 to 3. The names of the patterns are identified in column 1, the consolidated components of the patterns in column 2, and the pattern complexity score in column 3. Each organizational pattern's complexity score identifies its capacity for change. From these scores Glor developed a complexity or adaptability ranking for each pattern (Glor, 2007a, Table 5). In Table 1, column 3, Kauffman's patterns, which he called categories of system flexibility, are assigned to Glor's patterns. Glor's assignment of complexity ranges to Kauffman's patterns is outlined in column 5. Her identification of the direction in which the Glor and Kauffman patterns move is reproduced in column 6 from Glor, 2007b, Table 2, column 9).
Three possible directions for organizational pattern movement are identified: converging, neither converging nor diverging, and diverging. Converging patterns can be expected to move very little; if they move, it will be toward more of the same, usually less complexity. At the same time, fixed patterns that are close in complexity to that of other patterns will be drawn to them as basins of attraction. Patterns may thus be drawn to contradictory attractions, experiencing convergence or divergence as well as a basin of attraction created by a pattern. Isomorphism could thus be caused both by convergence and by strong basins of attraction. Patterns that are neither converging nor diverging can be expected to remain the same for awhile, but they are not stable like the converging patterns. When they change, most fixed patterns can be expected to become less complex, and some may eventually die. The EOC pattern is somewhat unstable but some things may be able to be said about how they will change (see later). The chaos pattern evolves quickly and according to Kauffman, can be expected to become more and more complex and more and more chaotic, leading to crises. Other possibilities are discussed later.
This analysis establishes the direction in which the patterns are likely to move, based upon the likely direction of movement of complex systems. The boundaries of organizational pattern complexity between fixed and EOC and between EOC and chaos were assigned by Glor (2007b) using scores from the patterns (Glor, 2007a). According to Glor (2007b), a fixed pattern has a score of 0 to 2.5, EOC between 2.6 and 3.9, and chaos 4.0 and higher. The scores have been assigned somewhat differently in Table 2, to allow for organizational mortality and to assign equal amounts of complexity to each pattern.
Table?2:?Assessing?effects?of?basins?of?attraction
The Imposed pattern range starts at 1 rather than 0 because it is a changing pattern. There may be patterns that are not changing, with even lower scores, that are on a path toward mortality.
The ranking (column 6) is from 1=closest to a pattern change to 5=farthest from a pattern change.
Note: The mortality, downsizing, buy-in+, transformational+, necessary+, continuous-, continuous-- and continuous+ patterns have not been found, but are hypothesized.
Glor proposed that each of her organizational innovation patterns existed in one of the Kauffman systems. Following an analysis of the complexity of her eight innovation patterns, she arranged the patterns into a hierarchy of complexity and assigned the patterns to Kauffman's three systemic categories of complexity (Glor, 2007b) (reproduced in Table 1). The quantitative complexity of the eight patterns and where they fit in the broader categories of complexity has been suggested. Glor thus answered the question of what direction organizational patterns will move: Fixed patterns become less complex in relation to their environments and EOC and chaotic patterns move in the direction of more complexity unless affected by other factors. While Kauffman asserted that complex systems only become more complex, he identified a fixed category that was converging. His patterns were not seen as having the capacity to become less complex, but Glor suggested that the imposed, reactive, active and buy-in organizational patterns will grow less complex (due to entropy) unless there is intervention in the system, typically through increased resources. The necessary and transformational patterns, on the other hand, based only on their complexity, continue to grow more complex and will eventually evolve, as Kauffman suggested, into chaos. The continuous pattern will continue to grow more complex and evolve at an accelerating pace. The buy-in and proactive patterns may oscillate between the two patterns.
The direction of change, then, is largely affected by whether the patterns are inclined to converge or diverge. Kauffman's findings for networks are applied to organizational patterns.
Magnitude of change required to change pattern
The required magnitude of change is affected most by complexity. Based on modelling, Kauffman found that systems in the fixed category changed complexity the least and were insensitive to initial conditions. The EOC and chaos patterns changed the most and were the most sensitive to initial conditions. If Kauffman is right, based only on a complexity score, and the knowledge that fixed patterns are converging, we know that the converging patterns could decline in complexity relative to their environment. Considering only complexity, only the fixed (converging) patterns could move in a less complex direction, while the EOC and chaos patterns would only add complexity.
Informed by direction, how would the patterns be likely to change? Would they move through Glor's patterns steadily, accumulating complexity and small changes until they reached a Kauffman pattern boundary and changed their behavior substantially, or would they be more likely to leapfrog patterns by suddenly losing or adding large amounts of complexity? Both are possible but because adding a lot of complexity to an organization usually requires new resources, leapfrogging would probably happen only rarely, when new resources are available. Patterns would likely increase their complexity steadily and leapfrog occasionally.
Magnitude of change needed to change a pattern or distance to the next pattern is assessed by the difference between current complexity measures and distance to the next lowest or highest complexity scores that involve a pattern change. Table 2 provides a calculation of the distances to a pattern change. In Table 2, column 7, the minimum complexity a pattern would need to delete to move to a less complex pattern is calculated by subtracting each pattern's score from the score at the top of the next lower pattern range. The minimum complexity a pattern would need to add to move to a more complex pattern is calculated in column 5 by subtracting the pattern's score from the score at the lowest edge of the next most complex pattern. This offers an indication of the magnitude of change required to change pattern. These calculations provide a comparable measure of how much complexity the pattern must delete or add to move into a contiguous pattern.
Difference?between?each?Glor?pattern?score?and?the?score?at?the?bottom?of?its?next?higher?Glor?pattern?range?(i.e.,?to?a?pattern?change)
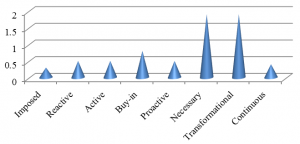
How far it is to an increase in pattern complexity is graphed in Figure 1. It presents column 5 of Table 2, with the X axis being the range of complexity scores in the patterns and the Y axis being Glor's eight patterns, beginning at the top of the Table 2 column. Based on the ranking of the distance to a change in pattern from closest to a new pattern (rank 1) to farthest from one (rank 5) (Table 2, columns 6 & 8), it is clear that some patterns need to grow in complexity considerably more (e.g., necessary/transformational) than others (e.g., imposed) before they can change to a more complex pattern. Some patterns (imposed, continuous) are close to a Glor pattern and are therefore more ripe for a change to a more complex pattern. The imposed pattern complexity score is closer to the next higher boundary than the other patterns, but it is still only middling close. It has a low complexity score and the pattern is converging, so it may have little capacity to move to a more complex pattern.
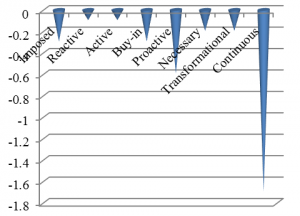
Mathematically, the distance from the complexity pattern score of each of Glor's patterns to the upper edge of the pattern to which a Glor pattern would need to decline to change pattern is identified in Column 7 of Table 2 and is graphed in Figure 2. While Kauffman found in his agent-based modelling that patterns continually grew more complex, even when constraints were placed on them, he also found that some patterns were fixed and converging. In the world of living creatures, humans sometimes make organizations less complex or cause them to converge on one model. Where the Kauffman chaos pattern begins is somewhat uncertain in terms of scoring and requires analysis of more population patterns. Given what we know, the bottom of the Kauffman pattern of chaos is treated as the bottom of the Glor continuous pattern (it is the only data we have).
Difference?between?each?Glor?pattern?score?and?the?score?at?the?top?of?its?next?lower?Glor?pattern?range?(i.e.,?a?pattern?change)
The reactive and active patterns need to lose the least complexity in order to change to a less complex pattern. The continuous (by far) and proactive patterns would need to lose the most complexity to change pattern. We know, from our analysis, that fixed patterns are losing (relative) complexity, so moving to a less complex pattern seems plausible for the reactive and active patterns. They would likely converge to an imposed pattern. Since the additional complexity and change required to move into a more complex pattern is small for the continuous and proactive patterns, they would be more likely to move to a pattern at a higher level of complexity—considering only complexity. The reactive and active patterns would be the least likely to move to a more complex pattern. For them, losing complexity is more likely than adding it.
Basins of attraction
As explained earlier, patterns whose complexity is proximate to a boundary (lower or upper, but especially upper) are drawn to the basin of attraction of that pattern. Such patterns are therefore more likely to change and will move more quickly into that pattern than patterns that sit in the middle of a range. Fixed patterns tend toward isomorphism and organizations tend to coalesce more with organizations and populations of similar or compatible pattern. Compatibility may be influenced by the extent to which the patterns share factors—motivation, organizational culture and challenges. Much of the initiative for change in the fixed patterns may come from inside the organization—management motivating staff, a top-down organizational management environment, and challenges addressed. The patterns become more complex as more self-generated motivation, social supports, and external resources are put into organizational change and innovation and more substantial challenges are addressed. In other words, patterns act as attractors for organizations and populations of organizations. The fixed patterns would likely develop less and less complexity and the patterns would become less capable of addressing challenges. Eventually organizational and organizational pattern death could occur.
Glor's patterns with the lowest complexity scores (imposed, reactive, active and buy-in) fit within Kauffman's fixed/converging category. These low-complexity innovation patterns are not, however, all equally fixed. Considering the complexity scores and ranking of closeness to their boundaries, patterns are farther from and closer to neighboring patterns. In Table 2, columns 6 and 8 rank which patterns are most likely to change within the far/close continuum. Some high-ranking (“1”) complexity patterns are closer to change than others, however.
Incidence of change
The incidence of change derives from the basins of attraction, whose analysis considered complexity. Consider an example. The reactive and active patterns sit in a basin of attraction (assuming it extends at least one unit of measurement each side of a pattern boundary), drawing them to the imposed pattern. They are the only patterns sitting in a basin. The reactive and active patterns are therefore the most likely to experience an incidence of pattern change. All the other patterns experience milder forces from the basins of attraction. The incidence likelihoods for all patterns are outlined in Table 3.
Table?3:?Likely?incidence?of?pattern?change,?based?on?basins?of?attraction
It is worth noting the patterns that are experiencing milder but still some effect from the basins of attraction (ranks 2, 3 in Table 2). They are also listed in the middle row of Table 3, but it should be kept in mind that the proactive pattern only experiences a basin of attraction if there is such a thing as a Buy-in+ pattern. The buy-in+ pattern has not yet been found. These patterns are not likely to create incidents on this basis alone, but perhaps they have an effect when combined with other forces. It is also noticeable that the distances (complexity change needed) to change pattern are different for increasing as opposed to decreasing complexity. In the analysis of incidence done for the patterns in Table 3, it is more likely that patterns will decrease complexity than increase it because most of the pattern scores are closer to their lower boundaries than to their upper boundaries. This could be merely an artifact of the examples used to develop these patterns and that other analyses would find patterns closer to their upper complexity limits. The issue is worth watching, however.
Speed of evolution
Another important dynamic affects how quickly patterns will evolve, namely, the speed of evolution. Speed is concerned with the rate of complexity change. According to Kauffman, fixed patterns are unlikely to move quickly, ones at the EOC are likely to move more quickly and ones in chaos are likely to move the fastest. If only the speed of Kauffman's patterns is considered, Glor's imposed, reactive, active and buy-in patterns are likely to move slowly, the proactive, necessary and transformational patterns are likely to move faster, and the continuous pattern is likely to move fastest; in other words, the most complex patterns change the fastest. Speed probably interacts with another factor, however. The speed of change of patterns close to Kauffman boundaries is probably accelerating, due to the basins of attraction. The reactive and active patterns, for example, would be expected to be moving slowly. The basin of attraction of the reactive and proactive patterns, however, probably causes them to accelerate their rate of change as they move through the boundary between them and the imposed pattern. The buy-in, imposed and other medium likelihood patterns are probably affected somewhat, but are unlikely to increase the speed of their changes by much. We can nonetheless distinguish rates of pattern change among the patterns.
Where change could lead
Organizational population change patterns are formed from what is happening in organizations in populations. Researchers have found patterns related to such structural inertia factors as organizational age and size (Hannan & Freeman, 1984; Singh, House & Tucker, 1986b; Barnett & Amburgey, 1990; Barron et al., 1994), environmental factors such as time period, resources and politics (Hannan, 1988: 101; Pfeffer & Salancik, 2003), and adaptation factors such as leadership, networks and communities (Baum, 1996). The scoring process used to assess complexity reflects some of these factors, such as top-down and bottom-up leadership and individual motivation, that affect perceptions of legitimacy internal to organizations. Challenges arise both internally and from the environment. All these factors are important to pattern change, as are the five process dynamics discussed in this paper.
Without taking account of the program issues at work in organizational population patterns, but merely the likely evolutionary process dynamics (Barnett and Carroll, 1995) , this analysis has examined five dynamics that affect how patterns change—direction, complexity, basins of attraction, incidence and speed of change. Direction describes whether patterns are converging or diverging. Complexity affects patterns in three possible directions—no/little change in complexity, leading to no change in pattern; reduced change; and increased change. With the laying down of initial rules and conditions, Kauffman's models only led to more complexity. In human systems, however, with the expression of will through factors such as power, authority and isomorphism, systems are capable of both increasing and decreasing in complexity. In the analysis conducted, and especially with the continuous pattern sitting far from the transformational/necessary EOC boundary, there was a great deal of movement to less complexity. Other sets of assumptions and analyses of patterns could lead to increased complexity, but this analysis found overall declines in innovation and change. Basins of attraction affected patterns that are close to boundaries—there were only two—the most. A variance in incidence of change is only likely for patterns in basins of attraction. Speed of change is affected by both complexity (and which Kauffman category the pattern is in) and the pull of basins of attraction (which are strongest at Glor pattern boundaries).
The important finding is that patterns can change, becoming more or less complex as they evolve. They can change direction. For example, patterns might become less complex in a downsizing environment but change direction and become more complex if new resources were made available. This happened in the population of the Government of Canada [GoC]) with its major mid-1990s downsizing followed by economic expansion and increased tax revenues for the federal government. There wasn't the same dynamism in the government afterward, however, compared to the period of the early 1990s when innovation was encouraged. Moreover, to some extent the authoritarian pattern introduced to create the downsizing acted as an initial condition and was more actively adopted by the newly hired employees. Top-down patterns became more likely as a result.
Table?4:?Dynamics?of?evolution?of?organizations?—?Round?one
Notes: Convergence means becoming less complex. Divergence means growing more complex.
+ and - means no pattern has been identified in the complexity range, so the putative pattern has been named for the next lower or higher pattern, designated with a +; ++ or - - means second hypothesized pattern in a range.
The overall impact of these five dynamics on population patterns is not necessarily predictable. At the same time, it is possible to identify the dynamics, the most likely changes in factors and how they could be expected to act and interact. This provides a window on the future, even if the window is translucent. Table 4 outlines possible effects of the five dynamics during a first round of evolution. If a majority of the forces is pulling in the same direction, the pattern will move in that direction. The changes have been assigned numerical values by the author - these are based on judgement, not measures.
Using the results from Table 4 as the first round of change, Table 5 shows the first four likely rounds of change (evolution). In this evolution, the patterns most likely to change do so. Surprisingly, in round 1 the number of Glor patterns already declines, from eight to four. In round 2, the number of Glor patterns remains at four. During round 3, the number of Glor (the observed) patterns declines even more to three. When only these factors are considered, the number of patterns remains at 3 in round 4. In this modelling, the Glor patterns decline from eight to three within four rounds of evolution. They clearly change.
Table?5:?First?four?rounds?of?pattern?evolution,?based?on?likelihood
Rules of evolution:
After four rounds, three patterns remain--reactive, proactive (proactive is cycling with the buy-in pattern) and continuous. The most active patterns have either evolved into more complex patterns, at least for now, or they have disappeared. If the reactive pattern continues to lose complexity and moves into an imposed pattern, it will probably disappear. Only the cycling buy-in and pro-active patterns would remain, cycling between Kauffman's fixed and EOC patterns. The continuous pattern, moving the fastest, has been modeled as increasing in complexity and disappearing. Because it had so far to decline to a less complex pattern, because it was sensitive to initial conditions (chaos), and because it was diverging without a strong basin of attraction, the continuous pattern continued to diverge beyond its capacity to deal with its complexity. At the same time as Glor's continuous pattern disappeared, hypothesized pattern (continuous--) appeared (last column, Table 4).
This quick decline in the number of patterns certainly surprised the author. It would appear that organizational patterns may be isomorphic as well as organizations (which makes sense, since its organizations are). Of course, new patterns could at the same time be in the process of being created. Either way, there is far more organizational mortality and changed patterning than expected. This assessment could be correct, with changing organizational patterns with highly responsive organizations being the ones that survive. Alternatively, there could be other, unrecognized factors at work and other patterns as yet undiscovered that have basins of attraction. Glor (2013) found a very low mean annual mortality rate among normal organizational populations, so normal organizations are clearly resilient. This analysis may add credence to the idea that changing organizations and populations are not as likely to survive as normal ones. Some other factors that could be at work might include human will, a change in dominant patterns from the past to the future, unknown patterns, or a factor(s) that enhances organizational survival.
The patterns' change tendencies can now be suggested. The imposed pattern would likely continue to lose complexity and eventually most of the organizations in that pattern would disappear. An example is the ongoing and steady abolition and reduction in funding for social programs and social security programs in the GoC. The US is now going through a similar downsizing of the federal government and its social programs and has likewise devolved some of its deficit to lower levels of government. Mortality is being seen most visibly in U.S. municipalities going bankrupt: 13 in 2011, 12 in 2012, 5 in 2013 to July 19th, including Detroit[3]. Depending on whether powerful management and elected officials perceived the change as being necessary in order to deal with a specific problem or necessary to revitalize the organization and therefore needing a strong employee contribution and commitment, the reactive and active patterns would likely change into the imposed pattern as the organizations decline in complexity. The reactive and active patterns are dominated by extrinsic employee motivation, and therefore do not have much potential to flip into intrinsic motivation and add complexity that way.
The buy-in pattern has less potential to move to the EOC because it would need to add so much complexity and is not in a basin of attraction. It might begin to evolve more quickly if, for example, an external collaboration was created by employees and a bottom-up social dynamic developed (especially if supported by management). It could then move into a proactive pattern. The proactive pattern has the dilemma of some attraction toward greater complexity, but a strong basin of attraction toward the buy-in pattern and less complexity. Moreover, it sits in the lower portion of the EOC pattern, and so may have initial conditions in a fixed category. This will matter in the EOC patterns. If the proactive pattern did move into a buy-in pattern, we are positing the existence of a buy-in+ pattern between the buy-in and proactive patterns, with higher complexity than the buy-in pattern. If employees continue to be intrinsically motivated, and begin to take on larger challenges, a necessary pattern could develop and continue to create a highly dynamic pattern. Even if employees return to being extrinsically motivated, substantial evolution can occur. However, despite their high complexity contributing to accelerated change, the necessary and transformational patterns also have quite a strong basin of attraction toward the proactive pattern and less complexity. As they continue to evolve, necessary and transformational patterns could become less complex; alternatively, if a pattern emerges of addressing even greater challenges, they could potentially change from a necessary or transformational into an as yet unidentified EOC pattern with greater complexity than the transformational/necessary patterns. We identify these hypothesized EOC patterns as necessary+ or transformational+. They could continue to evolve into the hypothesized continuous—pattern.
What happens to the continuous pattern? This is unclear. Perhaps it will continue to evolve and become even more complex, moving into an as yet unidentified chaotic pattern with greater complexity. We identify this hypothesized EOC pattern as continuous+. The continuous pattern has the potential to spin off into dysfunctional complexity and disappear, because it lies far from the basin of attraction of the necessary/transformational patterns. At the same time, if there is a continuous- (minus) pattern in the 4.9 to 5.4 complexity range, the continuous pattern would have some influence from its basin of attraction. It such a case, it may have some potential to reduce its complexity and perhaps (unlikely) move back eventually into an EOC pattern. Given its high complexity, high speed of change and diverging character, the continuous pattern is more likely to continue to grow in complexity and eventually disappear.
Some factors act against this possibility. As with all patterns, the people in the organizations in the continuous pattern will be trying to find ways to help the organizations survive. If the organizations are large, they will not tend to support either bottom-up management or intrinsic motivation in their employees for long. Rather, both may tend to be transitional states, as organizations deal with threatening environments. When and if the continuous pattern moves into the EOC, sensitivity to initial conditions could drag the pattern back into chaos. If it does, its sensitivity to its initial conditions in a continuous pattern may pull it back in.
Consider an example of a continuous change pattern: the Government of Saskatchewan (a Canadian province). Prior to 1944, the province elected conservative and liberal governments. From 1944 to 1982, it elected many social democratic and one conservative Liberal government. The social democratic government created continuous change while the Liberal government of 1962-71 functioned in a reactive pattern. This would seem to indicate that it is possible for a chaotic pattern to flip into a fixed pattern, but it flipped back again in 1971 and has elected alternating right of centre social democratic and extreme right-wing governments since then. The right-wing conservative governments have consistently driven the province into deep debt and the social democratic governments have worked to balance the budget. The conservative governments have been ideological while the social democratic ones have been more pragmatic. This has been a switch from the earlier period of 1944 to 1982, when the social democratic government was more ideologically left wing (but kept the budget in balance). The pattern has been one of continuous change with a pattern of regular (eight year cycle) changes of government. The social democratic party moved from left of center to right of center while the conservative parties moved from right of center to extreme right. The continuous change pattern has continued to exist, with the economic environment, the roles of political parties, and political and public servant actors changing (the right wing conservative government of 1982 fired and pushed out a large number of public servants and replaced them with their supporters). This continuous change pattern survived a long time in chaos (69 years).
Something can also be said about the likelihood of change. Based on the analyses in this paper, only relative statements can be made. Kauffman discovered that the most likely patterns to change are the most complex ones and the current analysis proposed that the ones that need to add the least complexity would change first. Accordingly, the reactive, active and proactive patterns, sitting on the boundary of complexity with the next less complex pattern and in its basin of attraction, would be inclined to change—the reactive and active patterns to the imposed pattern; the proactive pattern to the buy-in pattern. Likewise, the fixed buy-in+ pattern would be likely to change to the EOC proactive pattern, because it sits in the basin of attraction for it. This latter change may end up being an oscillation. These patterns are followed in likelihood of change by the necessary, transformational and continuous patterns, which are changing fast. They have conflicting tendencies, between being drawn back to the basins of attraction of a pattern with closer complexity and their tendencies to grow continually more complex due to already being very complex.
The incidence of two patterns being so close to the next lower complexity pattern helps to explain the disappearance of patterns in Table 5. The three patterns already the most complex—the transformational, necessary and continuous patterns—are changing the fastest. It would therefore be likely that the time before a pattern changes would be shortest in the continuous pattern—but it has far to go. While the patterns needing to add the least complexity to change to a more complex pattern are the reactive, active, imposed, proactive and continuous patterns (Figure 1), the pattern changing fastest is the continuous pattern. Which patterns would change first is uncertain. They are modeled with the reactive, active and continuous patterns changing in the first round.
While this analysis recognized that the continuous pattern is the most complex and the only one in chaos, researchers should watch for whether there are other patterns in the Kauffman chaos category, into which the continuous pattern could evolve. If not, the fate of the continuous pattern is uncertain. Its dynamics suggest it would spin off into mortality, having consumed too many of its resources, rather than diverging to EOC. On the other hand, that is what the example—Saskatchewan—did, so it is possible. According to the modelling, chaos patterns would be temporary patterns, as would the imposed, reactive, active and proactive patterns.
Hypotheses
On the basis of the preceding analysis, it is possible to assert a number of probabilistic hypotheses about the direction, likelihood and speed of change of organizational pattern change. These hypotheses are not all compatible.
Direction:
Hypothesis 1, H1: Given sufficient resources, organizational change patterns will tend to become more complex.
H2: If an arrow of complexity is at work (as Kauffman found in his agent-based modelling), and complex systems (organizations) tend to become more complex over time, then organizations are unlikely to move back to less complex states but rather they are more likely to move in the direction of the next most complex pattern.
H3: If organizations tend to become continually more complex as Kauffman's (1995) modelling found, then, if the distance to the next pattern is a long distance, the organization is likely to remain in the same pattern for a long time while it grows more complex and enters a region of complexity suitable for a shift, which can be described as an attractor.
H4: If organizations tend to match their complexity to that of their environment, organizations will grow more complex as their environments grow more complex and will decline in complexity as their environments decline in complexity.
H5: If a pattern is close to another pattern, it is more likely to change into that pattern perhaps because it shares some of its characteristics including complexity, that act as an attractor.
H6: Both converging and diverging organizational patterns are more likely to move to the next less or more complex pattern than to a pattern that is very different in complexity.
H7: If there are two potential patterns (with the same complexity score) for a pattern to move to, the pattern that is changing is most likely to move to the new pattern that is more similar to its own pattern of functioning (e.g., individual motivation, social dynamics, challenge of implementation).
Likelihood:
H8a.: If the added/reduced complexity and change required to move into a new pattern is small, it is more likely to occur;
H8b: If the amount of change in complexity required to move into a new pattern is large, it is less likely to occur.
H9: Patterns near other patterns will experience the other pattern as a basin of attraction.
H10: Organizations most likely to change pattern are those that require little change in complexity, are close to a basin of attraction and are changing fast.
H11: The next most likely group of organizational patterns to change are the ones that are more than half way to the next pattern and are changing fast.
H12: The least likely patterns to change are the ones in the fixed Kauffman pattern and that are near the middle of a pattern range. They would need to lose or add considerably more complexity before they would likely change pattern.
Speed:
Conclusion
According to this analysis, Glor's eight patterns are eventually likely to decline to three patterns. This change in pattern structure will likely be induced as a result of five forces—convergence/divergence, complexity, basins of attraction, incidence and speed. Darwin concluded that stability in natural systems cannot be imposed by natural selection—it must arise as a condition of evolution itself (Kauffman, 1995: 80). In these patterns, stability did not develop but cycling did. Systems with eight states (such as Glor's), allowed to evolve and change, settle down to three states, according to Kauffman (1995: 83). The analysis in this paper showed how this might happen with organizational patterns. The organizational patterns are likely to evolve into other patterns and new patterns may emerge. The three patterns that Glor's eight patterns evolved into were not, however, the three Kauffman patterns, only two of them (fixed and EOC). Evolution occurred within and across Kauffman patterns. What Kaufman did not predict was that fixed patterns would disappear, but they were shown as doing so here. This reduction in number of patterns supports Kaufman's prediction but also isomorphism, the idea that organizations change in their youth but change less as they age, becoming fixed and unresponsive.
Should Glor's population patterns evolve to different patterns, the patterns likely to change soonest are the continuous pattern because it is changing so quickly, followed by the reactive/active patterns, because they are sitting within a basin of attraction. In this modelling, three fixed patterns and the chaotic pattern disappeared and the three EOC patterns moved to a Glor, cycling proactive—buy-in+ pattern (which was a fixed—EOC Kauffman pattern). This suggests that eventually organizational pattern evolution is headed toward only three change patterns. This could limit diversity and possibly lead to fewer new ideas and innovations. In this sense organizational pattern evolution might reduce capacity to evolve and rate of change. To create and maintain organizational vitality and resilience, organizations need to support diversity, complexity, the capacity to change and complex basins of attraction. While, according to Kauffman, the most unstable pattern was in chaos (continuous innovation), in this modelling all the patterns changed and therefore turned out to be somewhat unstable. They ended up in different states, however. The three least complex patterns died out, the three patterns at the EOC ended up cycling between the fixed buy-in and the EOC proactive patterns, and the continuous pattern ended up in EOC with an uncertain future direction. Falconer's description of organizational change patterns as “highly unstable states of order that are then as quickly lost” (2002: 126) was closer to these results than expected.
Notes
An earlier version of this paper was delivered at the annual conference of the American Society for Public Administration, March 2013.
An organizational community is a set of diverse, interacting, internally homogeneous populations that are functionally integrated, emergent systems that gain some autonomy from their environments over time (Astley, 1985: 224, 234).
Reuters. 2013, July 19. Factbox: Recent U.S. municipal bankruptcies, collected July 23, 2013 at: http://www.reuters.com/article/2013/07/19/us-usa-detroit-cities-factbox-idUSBRE96H1BR20130719.
Appendix 1: Some environmental inputs to organizational pattern change
*Two or more populations are interacting if the presence of one affects the growth rate of the other(s) (Hannan, 1988: 99-100)
** Lamarckian evolution is the idea that an organism or organization can pass on characteristics acquired during its lifetime to its offspring. While this does not appear to be true of organisms, it is often true of humans and organizations (through learning). Darwinian evolution occurs only through the passing on of genes, the maps of organisms, to subsequent generations of organisms.
***Networks=micro-communities